Showing posts with label Asia's economies. Show all posts

Friday, April 29, 2011

Increasing Dependence on Asia

The IMF has just released its new Regional Economic Outlook: Asia and Pacific: Managing the Next Phase of Growth, April <http://www.imf.org/external/pubs/ft/reo/2011/APD/eng/areo0411.htm>. There is an interesting little section on "Spillovers from Emerging Asia to Australia and New Zealand" on p.6. 

The IMF notes that Australia is now much more dependent on "Emerging Asia's" (that's a category that includes China, Hong Kong SAR, India, Indonesia, Korea, Malaysia, the Philippines, Singapore, Taiwan Province of China, Thailand, and Vietnam) demand than it ever has been before. While this has been beneficial for Australia in recent years as Asia recovered quickly for the GFC and global recession, it also means that a slowdown in Asia will be felt brutally in Australia. As the IMF points out Australia’s exports to Asia have increased from 40 per cent of the total to 60 per cent between 2000 and 2010. Using a structural vector autoregressive (VAR) approach, the IMF concludes that over the past 10 years economic shocks from Asia are now considerably more important to the Australian business cycle than shocks from the United States.  
For the sample period 1991–2010, a 1 percent shock to U.S. GDP is found to move Australian growth by about 0.4 percent. In contrast, GDP shocks from emerging Asia have an almost negligible impact on Australian growth. This result changes dramatically when limiting the sample period to 2000–10, for which a 1 percent shock to emerging Asia’s growth is found to shift Australian growth by ⅓ percent, whereas the impact of U.S. GDP shocks on Australia is no longer statistically significant.
Commodity prices dominate the transmission of shocks from emerging Asia to Australia. The three transmission channels identified in the model—trade, commodity prices, and financial variables (including interest rates and equity prices)—account for most of the estimated spillovers to Australia. In particular, commodity prices alone explain half of the spillovers from emerging Asia to Australia.
This means that Australia that there has been a switch in business cycle dependence - Australia has "decoupled" from US growth over the past 10 years and "coupled up" with Asia over the same period. 
Note however that the jury is still out about whether Asia has decoupled from the United States over the longer-term. (Although it certainly appears that the decouplers are currently on top). The rest of Asia of course is increasingly tied into China's fortunes, making debates about China's inflation, housing bubble and debt increasingly important. 


The IMF, like most Australian economic bureaucrats is bullish about Australia's economic future: 
The long-term trend of continued strong growth in emerging Asia bodes well for Australia. The IMF’s Global Economy Model (GEM) can be used to assess emerging Asia’s impact on Australian long-term growth prospects. The model captures two main channels through which emerging Asia’s growth can affect Australia: trade integration and terms-of-trade gains. The simulation suggests that, should emerging Asia continue to grow notably faster than the world average, the impact on Australia will be even larger than in the past. This larger impact reflects both the increase in emerging Asia’s economic size and Australia’s growing integration with emerging Asia. Over the next 10 years, the model suggests that a 50 percent increase in emerging Asia’s real GDP, driven by tradable sector productivity growth, would raise Australian GDP by about 20 percent (figure). However, should emerging Asia’s economic growth become more balanced, with productivity growth in both tradable and nontradable sectors contributing equally, the growth dividend is roughly cut in half, owing to more modest improvements in the terms of trade of Australia.

A few other graphs also make interesting viewing about Australia's position in Asia. The first shows that Australia has relatively high real (after inflation) interest rates compared to a selection of other Asian economies and the second shows the significant real appreciation of the Australian dollar


Thursday, February 3, 2011

Latest Data on the World Economy

The Reserve Bank of Australia provides a monthly snapshot of the world and Australian economies through its Chart Pack. As I've argued before there really is no better source of graphical insight into the Australian economy. Unfortunately, they won't release the raw data for some of the graphs because some of the data is subject to copyright.


This first one shows the recent downturn in world growth and why Australia has done relatively better than the rest of the world. Compared to the world as a whole, Australia's trading partners have recovered more rapidly, with China and India (and the rest of Asia) doing far better than the Europe (with the exception of Germany) and North America.  But it also shows just how severe the drop in growth was at the bottom of the recession and how government action made such a big difference. Paying off some of that govt action, however, will make a difference to GDP growth with the UK's recent economic contraction an indicator of possibilities elsewhere of retrenchment. The US of course has eschewed such hairshirt policies and the graphs below on unemployment and inflation in the US provide some indication as to why this is the case.

This second graph shows just how severe the recession was in Japan, the United States and Euro area. The contraction was most severe in Japan, but it has recovered better.

Compare this to the Chinese and Indian experiences of the global recession. Note there was no slip into negative territory although some commentators argue that anything below 5-6 per cent growth in China might feel like a recession!! For an interesting take on Chinese GDP figures, have a read of Michael Pettis's recent blog piece.


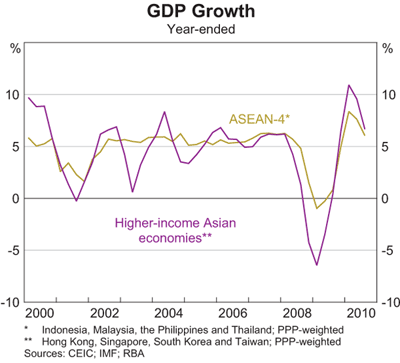
The rest of Asia did not do quite so well, but it shows why many commentators are arguing that Asia had a good global recession and why many people now think the 21st century will be dominated by Asia.


There is also a big debate going on about inflation pressures and many worry that monetary authorities (especially in the US and Europe) are not taking them seriously enough. Many of these same commentators don't seem to be too concerned about unemployment partly because they get extremely worried when labour markets tighten up (as they are in Australia). But the next two graphs show that at the moment unemployment should be the major concern of policy-makers in the US and Europe. Inflation obviously isn't the problem in Japan! Japan's issue is deflation. But falling prices might not be the good thing that your grandma might imagine. Just imagine her saying "things used to be so much cheaper when I was young". To crudely understand why this is a problem, think about why you would buy something today when it will be cheaper tomorrow.


The graph on unemployment should make us realise just how good a global recession we've had in Australia compared to the United States. With the amount of building work to be done to deal with natural disasters, it's unlikely that aggregate unemployment is going to be a major concern in Australia. No doubt, however, there are more concerns when we disaggregate the labour market and start to think about skills development and training etc.

Inflation, however, is a problem for China and India and efforts to deal with it could have an impact on Australia.

The next graphs shows the impact of Chinese government efforts to bolster the economy during the downturn. The year-ended growth figures are truly astounding as was the growth in credit. Although credit growth has declined, note what it has declined to!! It 'only' grew by around 20 per cent during 2010!


What does all this mean? Well for one thing how the Chinese government handles inflation and the growth in the Chinese property market are going to have large implications not only for Australia, but for the rest of Asia and, indeed, the whole world.

Tuesday, January 4, 2011

Predictions of Doom 2

Nearly all posts about the potential for doom in the Australian economy revolve around housing, either directly or indirectly. The best writers on potential housing trauma are Leith van Onselen who writes a brilliant blog backed by reasoned argument and a myriad of data (some of which I had referred to in my book so I know it's right!!). Other excellent doomsters are David Llewellyn-Smith and Delusional Economics. All believe that Australian house prices are over-valued and that household debt is a real problem for Australia. If you are inclined towards bearish sentiments about housing then these writers will seriously make you worry. While the housing market is obviously very important I want to focus on some bigger picture variables that will undoubtedly affect not just the housing market but the wider Australian economy.

Now the point is no one really knows what will happen to the Australian economy this year but we do know what factors will matter. Former RBA governor Ian Macfarlane once argued that if you only had one variable to understand the Australian economy then the variable you would choose would be the international economy. But the problem with this simplistic (but reasonably accurate) scenario is that the variable itself has changed. In other words the international economy as a variable affecting Australia has changed. The part of the international economy that matters most for Australia is now China and Asian generally. It would have seemed absurd 10 years ago to have a US economy in severe crisis and the Australian economy to be experiencing a boom, but the Chinese economy has changed the global economy enormously.

But as I've written continually the real question for Australia is how the sub-variable China is affected by the wider variable of the international economy, which is still dominated by the Western economies, despite the rise of the developing world over the last 20 years or so. Can China continue to grow in 2011 if the US and Europe remain affected by financial woes and hamstrung by low growth. This is the so-called de-coupling debate.

I've written previously about decoupling. Indeed I wrote in January last year that:
2010 will provide some further evidence for the long-running debate over decoupling. The financial crisis bolstered the anti-decoupling case as world financial markets were universally shaken by events in the United States. Since this time, however, the decouplers' argument has looked more sound as some began to talk of a North Atlantic financial crisis rather than a GFC. Certainly, Asia did well in 2009 compared to what many thought lay ahead at the end of 2008. Govt stimulus in China has helped enormously, but even in China this can't go on forever.

No doubt we shall get further evidence about whether China and the rest of Asia is ultimately as export dependent as economists like Stephen Roach contend and whether the issue of final Western demand really does continue to matter.  
Well it looks like the 2010 evidence is that decoupling had some legs over the course of last year, but at the risk of taking liberties on extensions (and to mix the metaphor) I think that the jury is still out. 2011 will provide further evidence because recent US tax cuts notwithstanding, the impact of fiscal stimuli throughout the world will be further unwound and the need to pay off debts will continue. Debt really is the thing to watch in 2010, not just public debt as the media wants to focus on, but household debt as well, not to mention the seemingly forgotten problem of foreign debt.

As David Barbosa writes in the NYT (via Michael Pettis):
For nearly two years, China’s turbocharged economy has raced ahead with the aid of a huge government stimulus program and aggressive lending by state-run banks. But a growing number of economists now worry that China — the world’s fastest growing economy and a pillar of strength during the global financial crisis — could be stalled next year by soaring inflation, mounting government debt and asset bubbles.
Now this is a common theme of China bears but Pettis is even more bearish:
I have almost no doubt that during 2011 all the growth expectations are going to be revised sharply downward. By the end of next year, I suspect that the consensus will be that for the rest of the decade we should expect growth rates in the 6-7% range for China.
Do I believe these lower numbers? Not really. About a year and a half ago I wrote in a Financial Times article that, assuming consumption growth could be maintained at 8-9% a year, Chinese GDP growth would average 5-7% annually over the rest of the decade.
My prediction caused a lot of strong disagreement and accusations of being overly pessimistic, but the truth is I think I was being optimistic. If GDP growth slows so substantially, it seems to me that consumption growth of 8-9% will be very hard to maintain, so I would argue that we should be prepared for even lower average growth numbers, perhaps in the 3-5% range. But I do think the consensus next year will migrate down to the 6-7% range, even though next year’s growth should remain high – probably in the 9% range.
Barbosa argues that Chinese problems will have significant ramifications for the rest of the world economy (a reversal of the traditional Western-led 'coupling' or 'globalisation' argument).
A sharp slowdown in China, which is growing at an annual rate of about 10 percent, would be a serious blow to the global economy since China’s voracious demand for natural resources is helping to prop up growth in Asia and South America, even as the United States and the European Union struggle.
And because China is a major holder of United States Treasury debt and a major destination for American investment in recent years, any slowdown would also hurt American companies.
Pettis does not agree with Barbosa that a slowdown in China will be bad for the world or for the US:
I am not sure why Chinese holdings of USG bonds suggest that a Chinese slowdown will hurt US companies, but I have already explained why I do not think a sharp slowdown in Chinese growth is necessarily bad for the world. It will be very bad for commodity exporters – or at least non-food commodity exporters, since I think the demand for food from China will continue strong – but the overall effect on the rest of the world depends on the evolution of China’s trade balance. A contraction in the surplus creates net demand for the world, and so might even be marginally positive.
This marginally positive outcome won’t be evenly distributed, of course. Non-food commodity exporters will be badly hurt, while commodity importers and manufacturers will benefit.
I don’t even think such a rapid slowdown in Chinese growth will be bad for China. Again it depends on how it takes place. If there is a serious attempt at rebalancing the economy by raising wages, interest rates and the currency, China can manage a much slower GDP growth rate while still maintaining a fairly high growth rate in household income and consumption. I discussed this in more detail in an entry last month.
Non-food commodity exporters obviously means Australia (although we do export food as well).

Pettis then provides some notes on what is worth watching in 2011. Wisely he does not call them predictions.
First, although I do not believe inflation [in China] is going to be as big a problem as many think (I believe the Chinese financial system has a built-in inflation-stabilization mechanism – see my November 18 entry), if I am wrong and inflation continues to rise, this will create a real problem for monetary policy.
Second, debt levels are worryingly high and are starting to act as a serious constraint on the rebalancing process. My friend Victor Shih at Northwestern University has done great work in trying to figure out the government balance sheet, and he worries, correctly, in my opinion, that it is becoming increasingly difficult for the PBoC to raise interest rates without creating a great deal of financial distress in government-related entities. Even the PBoC balance sheet is a real problem. How can they raise RMB interest rates without running a huge negative carry?
Third, the trade constraints are going to get worse, not better. Ashoka Mody and Franziska Ohnsorge have a very interesting piece on Vox that suggests that we shouldn’t count too heavily on consumption growth in the developed world to boost global demand. That means we are going to spend the next few years fighting over anemic demand growth, and we will be apportioning that demand via trade disputes.
Fourth, although GDP growth rates next year will be very high to see off the current leadership, I am pretty sure that by the end of the year there will be much more concern about the rebalancing process and what that will mean for growth rates. In order to get those high growth rates, I don’t think we need to take the 2011 lending quota too seriously. Whatever it is, it will be breached.
Another China-focused economist is Andy Xie who argues:
By the middle of 2011, most analysts may declare that the world has finally put the financial crisis behind.
The reality is quite different. The global economy is kept afloat by massive monetary and fiscal stimulus around the world. The main problem in the global economy – high costs and declining competitiveness in the developed world, and inflation plus asset bubbles in the developing world continue unabated. Either inflation in the developing world or unsustainable sovereign debt in the developed world will spark the next crisis.
...
The most likely candidates to trigger the next global crisis are the U.S.'s sovereign debt or China's inflation. When one goes down first, the other can prolong its economic cycle. China may have won the last race. To win the next one, China must tackle its inflation problem, which is ultimately a political and structural issue, in 2011. If China does, the U.S. will again be the cause for the next global crisis. China will suffer from declining exports but benefit from lower oil prices.
On the other hand, if China has a hard landing, the U.S.'s trade deficit can drop dramatically, maybe by 50 percent, due to lower import prices. It would boost the dollar's value and bring down the U.S.'s treasury yield. The U.S. can have lower financing costs and lower expenditures. The combination allows the U.S. to enjoy a period of good growth.
One could describe the global economy as a race between the U.S. and China, to see who goes down first.
This coming year is China's opportunity.
The best way for China to deal with inflation, according to Xie, is to address its property bubble.
China's inflation problem stems from the country's rapid monetary growth in the past decade. That is due to the need to finance a vast property sector, which is, in turn, to generate fiscal revenues for local governments to finance their vast expenditure programs. Unless something is done to limit local government expenditure, China's inflation problem is likely to get out of control.
The government now recognizes inflation as the country's main challenge. It has raised interest rates once, deposit reserve ratios several times, and announced its intention to introduce price controls. The barrage of unconventional measures is due to the belief that China's economy is different from others and the conventional measure of raising interest rates may not be effective or necessary. The reluctance to change the price of money and the willingness to change the price of goods and services has not worked well so far.
...
The ineffectiveness of the recent measures casts doubts on the government's sincerity in fighting inflation. The constant and marginal policy announcements could be interpreted that the inflation fighting is now largely a propaganda job. Such perceptions could spark popular panic, which would cause the household sector to hoard goods like rice and cooking oil. When the masses flee from holding money, a full blown crisis will unfold.
So at the beginning of 2011, we are in a similar position to the start of 2010. Debates about China will produce much heat in Australia, the real question is whether they'll produce any light. For what it's worth I think that economic liberal commentators have too much faith in the Chinese Communist leadership to manage the Chinese economy without booms and busts. While China will probably continue to grow rapidly over the medium term, the belief that it can continue to grow uninterrupted by poor policy decisions and the reality of economic cycles is pure fantasy.

I also have no doubt that by this time next year we'll have a clearer position on the debates about globalisation and decoupling and about the ability of Australia to profit from a long-term mining boom.

Thursday, December 2, 2010

Keep on Booming

I don't know about you, but whenever I read headlines like "20 year boom", my bullsh-t detector comes on hard and fast. While there can be no doubt about the current status of the boom as one of the biggest in Australia's history, the real question is whether it is going to be sustained into the future. While I think the Australian economy is travelling fairly well at the moment, I just don't have the faith that many seem to have in the projections of endless prosperity.

The last week or so has seen the Head of Treasury and the Reserve Bank Governor both talk about the possibility of a long-term China boom. Students of the Australian political economy wanting a snapshot of official thinking could do far worse than review the recent words of Ken Henry and Glenn Stevens.

So what did Australia's two most important economic bureaucrats actually say?

Henry was at a Senate Hearing into the government's mining tax and the exchange went like this (my emphasis in bold):
Senator HUTCHINS—Can I ask you to give a view about the uneven growth across the economy at the moment.

Dr Henry—It is quite uneven. Certainly there are some sectors of the economy that are growing very strongly and we would expect to see them continue to grow as strongly over the next several years. There are other sectors of the economy that are being affected, particularly by the high exchange rate, who are finding conditions more difficult. There are businesses also that if not affected by the high exchange rate are feeling the impact of rising interest rates and the dampening effect that those rising interest rates are having on demand. So there is some dampening of demand evident in the Australian economy currently. We would expect to see those trends continue for some time—for quite possibly several years.

So it is likely that we will see an Australian economy characterised by unprecedentedly strong rates of growth in some sectors of the economy, particularly in mining, mining investment and mining related construction activity, with other sectors of the economy growing somewhat slower than their historical trend rates of growth as the economy’s factors of production, principally labour but also capital, move from the slower growing sectors to the faster growing sectors of the economy. In this uneven pattern of growth the Australian economy is being restructured, if you like. There is a period of structural change that the Australian economy is going through. I have said publicly on a couple of occasions recently that the external shock to which the Australian economy is adjusting, and by that I am referring to historically high commodity prices and the high terms of trade that come with those historically high commodity prices, will quite possibly prove to be the largest external shock ever to hit the Australian economy, and it is causing quite a deal of structural change. To date, not a lot of that structural change has occurred—some has—but over the few years ahead, we should expect to see quite significant structural change in the Australian economy.
Senator HUTCHINS—So the non-mining sectors appear to need some sort of assistance — not assistance, but maybe they need to be recognised?

Dr Henry—It is not clear that assistance is what is required. After all, what could appear to be assistance to a particular sector that is finding the going a bit tough could translate into even higher interest rates and an even higher exchange rate and could make life even more difficult for those sectors that are struggling now and that would not be in receipt of assistance. I think it is important to recognise that the pattern of growth will definitely be uneven in the next few years and recognise the challenge that poses for the conduct of both macroeconomic and structural policies. It has to be recognised, but you have to be careful that in constructing any form of assistance you do not actually make the problem worse.

Senator HUTCHINS—Would cutting company tax be of assistance to these non-mining sectors?

Dr Henry—Yes, and it is one of the reasons—it is not the only reason—the tax review document recommended a cut in the company tax rate. Another reason was to reduce the cost of capital in Australia in order to provide a more attractive destination for investment. That was a long-term view that was being taken in the tax review. Another reason for the tax review recommending a cut in the company tax rate, in association with a resource super profits tax, was to rebalance the pattern of growth somewhat to provide a lower cost of capital for those sectors of the economy that are feeling the pressure that is being exerted by this very rapidly growing mining sector of the economy.

Senator HUTCHINS—One concern that has been expressed to the committee has been about this so-called Dutch disease, which you may have heard Professor Garnaut comment on in our hearing on Friday. What appropriate measures should be taken? Should they be similar to the measures taken by Norway? Are there other areas that should be explored or are we going down the right track at the moment?

Dr Henry—I have not had the advantage of seeing Professor Garnaut’s comments that he made to this committee on Friday. I think I can anticipate what he would have said in respect of Dutch disease and that is actually what I was referring to earlier when I was referring to the strength of the Australian dollar and the pressure that is putting on other sectors of the economy, particularly the trade exposed sectors of the economy. As to policy responses to so-called Dutch disease, without addressing particular policies I would say that in general terms it might be helpful to reflect on whether the increase in the exchange rate is considered to be only temporary or whether the increase in the exchange rate might reflect a medium-term or even a long-term change in Australia’s terms of trade. Typically the Dutch disease label attaches to instances in which the appreciation of the exchange rate is considered to be temporary but the economic effects of that appreciation are long lasting.

I think it would be sensible on this occasion to contemplate the prospect that there has been a structural change in our terms of trade not a short-lived change in our terms of trade and that that structural change in our terms of trade will have to be associated with any change in the structure of the Australian economy. If that is the case then in general terms, again without talking about a particular policy option, policy would do better to focus on what could be done in order to support the structural change that is going on in the economy in a way that does least damage to people’s lives. That might mean, for example, avoiding temptation to offer support to a particular business which, with these terms of trade, does not really have a long-term future in the Australian economy but to focus instead on programs that would support the transition of workers from that business to other businesses in the Australian economy which do have a longterm future with the sorts of terms of trade that we are confronting. That is a generalisation, I am conscious of that and you asked me about particular policies, but I would not want to at this stage get into arguing the merits of particular policies. I am happy to talk about policy approaches, but I would not want to get into a discussion of the merits of particular options.
The gist of Henry's Senate statement is that the boom will be structural rather than cyclical, which would mean considerable adjustment for Australians as capital and labour move away from other sectors of the economy towards mining. (This is a bit of a problem given mining's low employment to output ratio) It's also a non-too-subtle, even if indirect suggestion that Australia should not offer assistance to the manufacturing sector!

Australia's terms of trade are approaching the highest ever level as this excellent graph from RBA Governor Glenn Stevens' speech "The Challenge of Prosperity" shows. (For those interested I published an article in the Griffith Review entitled "The Politics of Prosperity" dealing with similar themes ... for a similar article but with graphs and tables see "Between Luck and Vulnerability")


I've spent a good deal of the year trying to explain to students in my Globalisation, the Asia-Pacific and Australia class the importance of the terms of trade. Indeed, I asked them in their exam why it mattered. I told them that if they fell asleep Rip van Winkle style for 20 years and wanted to get an immediate picture of the state of the Australian economy one of the best things they could do would be to call: "Get me the terms of trade!!"

It is worthwhile defining the terms of trade because it it is a fundamental measure of boom and gloom. The terms of trade is an index-measure ratio of the average price level of exports to the average price level of imports. It effectively reflects the capacity of a given quantity of exports to pay for a given quantity of imports, and provides an important indication of the strengths and weaknesses of the economic structure. A rising or falling terms of trade indicates the possibility of improving or declining living standards, because if what we sell earns relatively more than what we buy, we will be relatively wealthier. Because the terms of trade is a ratio, increases can be a result of export prices increasing at a greater rate than import prices, or export prices increasing while import prices are declining, or export prices declining at a slower rate than import prices. Of course, a rising terms of trade doesn’t stop us from buying more things than we sell, which we have made a habit of for much of our history! Improvements in the terms of trade are not reflected in GDP figures, but improvements do contribute significantly to increases in national disposable income.

Why it is important is, as usual, lucidly explained by the Governor.
You may have noticed the Reserve Bank saying a lot about the terms of trade in the past few years. Before I describe the chart, why is it important?
Our terms of trade have a big bearing on national income. In economic commentary, there is typically a very strong focus on GDP – the value of production – as a summary of national material progress. There is also quite rightly an emphasis on lifting productivity – real GDP per hour worked – as the source of our growth of material living standards.
For open economies, though, our standard of living is affected not just by the physical output we can obtain from our resources of labour and capital, but also by the purchasing power of that output over things we want to have from the rest of the world. This is what the terms of trade is measuring. It is the relative price of our export basket in terms of imports. At the extreme, if the economy were open to the extent that we exported all our production and imported all our consumption, then the price of exports relative to imports would determine our living standards entirely, for any given level of productivity per hour worked. As it is, Australia is not that open, and not as open as many smaller economies, but it is considerably more open than the really large economies like the United States, the euro area or Japan. So the terms of trade matter.
When the terms of trade are high, the international purchasing power of our exports is high. To put it in very (over-) simplified terms, five years ago, a ship load of iron ore was worth about the same as about 2,200 flat screen television sets. Today it is worth about 22,000 flat-screen TV sets– partly due to TV prices falling but more due to the price of iron ore rising by a factor of six. This is of course a trivialised example – we do not want to use the proceeds of exports entirely to purchase TV sets. But the general point is that high terms of trade, all other things equal, will raise living standards, while low terms of trade will reduce them.
He then argues that there are 3 key features of the long-term chart of the terms of trade.
The first is the degree of variability in the terms of trade through the middle parts of the 20th century, from about World War I to the aftermath of the Korean War. This was, of course, a period of considerable instability in the global economy, with the attempt to return to the Gold Standard after the ‘Great War’, followed by the 1930s depression, the Second World War, the post war expansion and then the Korean War. I might add that, in those days, with the attempt to maintain a fixed exchange rate, these swings were very disruptive to the economy. Typically, a rise in export incomes would result in a rise in money and credit, a boom in economic activity and a rise in inflation. Then the terms of trade would fall back and the whole process would go into a rather painful reverse. The advent of the flexible exchange rate in the early 1980s made a great difference in managing these episodes.
The second feature is the downward trend in the terms of trade, particularly noticeable from the early 1950s to about the mid 1980s. This was the period of resource price pessimism, the ‘Prebisch Singer hypothesis’ and so on, which held that primary products would tend to decline in price relative to manufactured products. The latter part of this period was the one in which the realisation became widespread that the (apparently) easy gains in living standards of the post-war boom were gone, and in which pessimism about Australia's economic future was probably at its most intense. It was also the period when, under strong political leadership backed by a highly capable bureaucracy and an economically literate media, our determination to press on with various productivity-increasing reforms was greatest. That these two phenomena occurred together was probably not entirely a coincidence.
The third feature is the current level of the terms of trade relative to everything but the all-time peaks over the past century. Measured on a five-year moving average basis, and assuming (as we do) some decline in the terms of trade over the next few years from this year's forecast peak, the terms of trade are as high as anything we have seen since Federation.
To give some perspective on how important this is, let me offer one back-of-the-envelope calculation. The export sector is about one-fifth of the economy. The terms of trade are at present about 60 per cent higher than their average level for the 20th century, and about 80 per cent higher than the outcome would have been had they been on the 100-year trend line. This means that about 12–15 per cent of GDP in additional income is available to this country's producers and/or consumers, each year, compared with what would have occurred under the average or trend set of relative prices over the preceding 100 years (all other things equal). That will continue each year, while the terms of trade remain at this level.
Of course, part of this income accrues to those foreign investors who own substantial stakes in the mineral sector. In this sense, the current boom is a little different from the early-1950s one where most of the income went first to Australian farmers. Nonetheless, a good proportion accrues to local shareholders and employees, and to governments via various taxes. A non-trivial part of it is available to consumers as higher purchasing power over imports, as a result of the high exchange rate.
... On all the indications available, we are living through an event that occurs maybe once or twice in a century.
Stevens then moves onto what should be done. This, he argues, depends on whether the higher income that accrues from a higher terms of trade is long lasting or fleeting.
If the rise in income is only temporary, it would be desirable not to raise national consumption by very much. Instead, it would make sense to allow the income gain to flow into a higher stock of saving, which would then be available to fund future consumption (including through periods of temporarily weak terms of trade, which undoubtedly will occur in the future). Moreover, it would probably not make sense for there to be a big increase in investment in resource extraction if that investment could be profitable only at temporarily very high prices (and which could come at the cost of reduced investment in other areas).
If the change is likely to be persistent, then income is likely to be seen as permanently higher. Households and most likely governments will probably see their way clear to lift their consumption permanently, both of traded and non-traded goods and services. Structural economic adjustment will also occur as the sectors whose output prices have risen, now being more profitable, will seek to expand, in the process attracting productive resources – labour and capital – away from other sectors whose output will decline as a share of GDP. Australia's floating exchange rate, which tends to rise in line with the increase in the terms of trade, helps the reallocation of labour and capital by giving price signals to the production sector. The higher exchange rate also speeds the spread of the income gains from the terms of trade rise to sectors other than the resources sector, by directly increasing their purchasing power over imports. The resulting rise in imports spills demand for tradable goods and services abroad, which helps to reduce domestic inflation.
All sounds hunky dory, but there is of course a sting in the tale as I summarised in an earlier post.
What most of the boomers forget is that price increases encourage supply increases, which then lead to oversupply and falling prices. This is the nature of the commodity cycle. No one knows this better that economist Bob Gregory, who adapting ideas about the so-called "Dutch Disease" - the negative impact resource booms can have on manufacturing sectors largely through a temporary rise in the exchange rate - to Australian conditions in the mid 1970s and which was then designated the "Gregory Thesis".
Gregory's major concern (as Henry argues above in relation to the Dutch Disease) is with a temporary rise in the exchange rate. This is a problem because the rise in the exchange rate may be long enough to force businesses in other sectors of the economy to the wall so that in the wash-up, resource demand is not sustained and important sectors of the economy are then diminished. In contrast, a sustained rise in the terms of trade will lead inevitably to a change in the structure of the economy as investment and people shift into mining and associated industries. This may still cause problems in the future as the economy becomes less diverse and less able to deal with an eventual collapse in the terms of trade.

As Stevens notes in relation to structural change:
It is easy, of course, to speak in the abstract of ‘reallocation of productive resources’, but this means that some businesses and incomes become relatively smaller; jobs growth in some areas slows even as in others it picks up. Some regions struggle more than others. Some sources of government revenue are adversely affected even as other sources see an improvement. This process will be seen, not unreasonably, as costly by those adversely affected, even though the overall outcome is that the country as a whole is considerably better off. (It is also obvious that, if the terms of trade change really is only temporary, it may not be worth paying these adjustment costs from the perspective of the overall economy.) The policy challenge for governments will be whether to help these sectors resist change, or to help them adapt to it.
In other words, interpretation of the sustainability of the current boom matters a lot!

Stevens argues we could try to keep the structure of the economy the same and resist changes, but correctly points out that would be stupid. We wouldn't want an economy dominated by agriculture as it was in the immediate post-war period and for a most of the time before that (gold booms notwithstanding). Remember the fate of wool, which was for so long our most important export and that now is not even in the top 25!

So if the terms of trade do remain fairly high for a lengthy period, the task is going to be to facilitate structural adjustment so as to make it occur in as low cost a way as possible. But that ought to be feasible given that overall income is considerably higher.
Of course we cannot know whether the terms of trade will be high for a long period. History certainly would counsel caution in this respect. We do know that supply of various resources is set to increase significantly over the years ahead and not just from Australian sources. It is for this reason that we assume some fall in commodity prices over the next several years. The assumption underlying the Bank's forecasts published a few weeks ago is that iron ore prices fall by up to about 30 per cent over the next several years. Even if they do, the terms of trade will remain quite high by the standards of the past 100 years in the near term.
Is that assumed fall realistic? There is no way of knowing. Larger falls have happened before. In fact they have been the norm. On the other hand, experienced people seem to be saying that something very important – unprecedented even – is occurring in the emergence of very large countries like China and India. If the steel intensity of China's GDP stays where it is already, and China's growth rate remains at 7 or 8 per cent for some years to come, which appears to be the intention of Chinese policy-makers, then the demand for iron ore and metallurgical coal will rise a long way over the next couple of decades. If India's steel intensity goes the same way as most other countries have, that will add further. Even with allowance for supply responses by other producers and considerably lower prices than we see today, that seems to point to a prominent role for the resources sector, broadly defined, over a longish horizon.
So the most prudent assumption to make might be that the terms of trade will be persistently higher than they used to be, by enough that we will need to accommodate structural change in the economy, but not by so much that we shouldn't seek to save the bulk of the surge in national income occurring in the next year or two, at least until it becomes clearer what the long run prospects for national income might be.
Stevens then explains that Australians are indeed currently saving more than they have for quite some time (hence the poor retail figures out today). "The net saving rate is now seen at some 9–10 per cent of income over the past year or two, up from about −1 per cent five years ago." There's nothing like a crisis to make people more cautious, especially given the fact that Australian households are more indebted than most other countries in the world and certainly vastly more than they ever have been in history.

Stevens speech makes clear that Australia and much of the rest of the world economy are increasingly dependent on China. Why this is not seen as more of a problem never ceases to amaze me! The assumption appears to be that China's growth will continue onward and upward and that India will join China and then surpass as it is better suited demographically for longer-term growth (i.e. more young people).

Given China's growing importance for the much of the world economy and certainly for Asia, there are also increasing indirect effects of Chinese growth on Australia. Our second biggest export market is, like us, more and more tied into Chinese growth. As Rintaro Tamaki, Japan's Vice-Minister of Finance for International Affairs, said: "We are not suffering from excess Chinese imports. We have a complementary relationship. We export parts and China re-exports the assembled products. So when China's exports increase, Japan's exports to China also increase." What this also means is that when China's exports decline, Japan's exports will decline helping to exacerbate the impact of a China slowdown on Australia. The same goes for South Korea as well, which also is increasingly tied into Chinese growth.

Now I don't want to sound too much like a negative vibe merchant here. While Australia remains vulnerable to changes in international demand and to international financial supply (just as it has done throughout its history), the most likely scenario for Australia over the next 20 years is, unsurprisingly, a variable (but higher) terms of trade, meaning a variable national income. Stevens thinks this too:
In the longer term, the economy's increased exposure to large emerging economies like China and India (these two now accounting for over a quarter of exports) – assuming that continues – may also pose important questions. If these and other emerging economies continue to grow strongly on average, but also, as with every other country, still have business cycles, the result may be the Australian export sector, and therefore the Australian economy, having a potential path of expansion characterised by faster average growth in income, but with more variability. That possibility has been noted by some observers. It is worth recording that such concentration would hardly be unprecedented – think about the dominance of Japan in Australia's trade in the 1970s and 1980s, or the dominance of the United Kingdom in an earlier era. Nonetheless, the degree of concentration could be higher than we have seen in the past decade or more, which was a time of considerable stability for the Australian economy overall.

Its probable that China and India will continue to grow rapidly for the next few years and at a slowing rate over the medium term, but it is unlikely that this growth path will be smooth. Capitalism generally means booms and busts. To think that growth will be smooth shows an enormous faith in the ability of the Chinese Communist Party to manage China's state capitalist economy. There is a beautiful irony in the faith that many economic liberals have in Communist economic managment skills! The thing that I think is unlikely is a 20 year boom, which implies no busts. For this to occur would mean that Australian history holds no lessons for Australia whatsoever. It would also mean that economics would have finally trumped politics. If I was a gambling man (and I am) I wouldn't bet my house on it (fortunately I don't own a house). There are just too many potential intervening variables for Chinese and Indian growth to be smooth! Maybe it's because I'm a poli sci major, but ultimately politics rules.


Given the likeliness of variability what should Australian policy-makers do? One solution would be to simply accept variability and deal with the fall out. Indeed this is probably the most likely outcome given the seeming inability of recent Australian governments to think beyond the short term.

But trying to save some of the income would be a better solution, using the proceeds of the boom to fireproof the Australian economy into the future. This would be a good solution regardless of whether the boom is temporary or more long-lasting or a series of boom-busts.

One of the ways of doing this would be to create a sovereign wealth fund like Norway has, which would mean the proceeds of the boom would be invested offshore. The foreign investment out of Australia achieved by a SWF would also help to slow the rise in the Australian dollar from a booming economy and would provide a store of savings for when the terms of trade were lower.

Stevens expresses the case slightly more esoterically:
Another approach would be to reflect the higher income variability in our saving and portfolio behaviour rather than our spending behaviour. We could seek to smooth our consumption – responding less to rises or falls in income with changes in spending and allowing the effects to be reflected in fluctuations in saving. In the most ambitious version of this approach, we could seek to hold those savings in assets that provided some sort of natural hedge against the variability of trading partners, or whose returns were at least were uncorrelated with them. Of course, such assets might be hard to find – the international choice of quality assets with reasonable returns these days is a good deal more limited than it used to be.
It is possible that this behaviour might be managed through the decisions of private savers. There might also be a case for some of it occurring through the public finances. That would mean accepting considerably larger cyclical variation in the budget position, and especially considerably larger surpluses in the upswings of future cycles, than those to which we have been accustomed in the past. There would also be issues of governance and management of any net asset positions accumulated by the government as part of such an approach, including whether it should be, as some have suggested, in a stabilisation fund of some sort. [He means here a SWF].
Of course if the China boom turns to a bust in the short- to medium-term then I get the feeling all talk of SWFs will be soon forgotten. Let's hope that we keep debating whether it'd be a good idea.

Tuesday, November 2, 2010

Australia's Dependence on China

The Economist in "The indispensable economy? China may not matter quite as much as you think" argues that while dependence on China is significant and growing, it might be overrated.  
It is hard to exaggerate the Chinese economy’s far-reaching impact on the world, from small towns to big markets. It accounted for about 46% of global coal consumption in 2009, according to the World Coal Institute, an industry body, and consumes a similar share of the world’s zinc and aluminium. In 2009 it got through twice as much crude steel as the European Union, America and Japan combined. It bought more cars than America last year and this year looks set to buy more mobile phones than the rest of the world put together, according to China First Capital, an investment bank. ...
China is now the biggest export market for countries as far afield as Brazil (accounting for 12.5% of Brazilian exports in 2009), South Africa (10.3%), Japan (18.9%) and Australia (21.8%).
But given that exports are only a little bit over 20 per cent of GDP in Australia exports to China as a percentage of GDP "are only 3.4% of GDP in Australia, 2.2% in Japan, 2% in South Africa and 1.2% in Brazil." It's important to remember that domestic spending matters most. While production for exports has a multiplier effect through the wider economy, this should not be exaggerated:
these “multipliers” are rarely higher than 1.5 or 2, which is to say, they rarely do more than double the contribution to GDP. Moreover, just as expanding exports add to growth, burgeoning imports subtract from it. Most countries outside East Asia suffered a deteriorating trade balance with China from 2001 to 2008. By the simple arithmetic of growth, trade with China made a (small) negative contribution, not a positive one.
Multipliers in Australia derivative from Chinese demand might be larger than this in Australia however. What this attempt to downplay the China boom  doesn't capture is the confidence effect of a booming China and the huge expansion of investment in Australia aiming to cater not only for Chinese demand but the considerable increase in demand in Asia as a whole. Let's not forget that Japan and South Korea remain vital sources of demand for Australian exports and India and Indonesia are growing rapidly as well.

There are some countries, however, considerably more trade dependent than Australia as the graphic below shows.


China plays a larger role in the economies of its immediate neighbours. Exports to China accounted for over 14% of Taiwan’s GDP last year, and over 10% of South Korea’s. But according to a number of studies, roughly half of East Asia’s exports to China are components, such as semiconductors and hard drives, for goods that are ultimately exported elsewhere. In these industries, China is not so much an engine of demand as a transmission belt for demand originating elsewhere.
The share of parts and components in its imports is, however, falling. From almost 40% a decade ago, it fell to 27% in 2008, according to a recent paper by Soyoung Kim of Seoul National University, as well as Jong-Wha Lee and Cyn-Young Park of the Asian Development Bank. This reflects China’s gradual “transformation from being the world’s factory, toward increasingly being the world’s consumer,” they write. Gabor Pula and Tuomas Peltonen of the European Central Bank calculate that the Philippine, South Korean and Taiwanese economies now depend more on Chinese demand than American.
Trade is not the only way that China’s ups and downs can spill over to the rest of the world. Its purchases of foreign assets keep the cost of capital down and its appetite for raw materials keeps their price up, to the benefit of commodity producers wherever they sell their wares. Its success can boost confidence and productivity. One attempt to measure these broad spillovers is a paper by Vivek Arora and Athanasios Vamvakidis of the IMF. According to their estimates, if China’s growth quickened by 1 percentage point for a year, it would boost the rest of the world’s GDP by 0.4% (about $290 billion) after five years.
The Economist argues contrary to the general opinion in Australia that a major downturn in the Chinese economy would not be devastating.
Since the crisis, China has shown that its economy can grow even when America’s shrinks. It is not entirely dependent on the world’s biggest economy. But that does not mean it can substitute for it. In April the Bank Credit Analyst, an independent research firm, asked what would happen if China suffered a “hard landing”. Its answer to this “apocalyptic” question was quite “benign”. As it pointed out, Japan at the start of the 1990s accounted for a bigger share of GDP than China does today. Its growth slowed from about 5% to 1% in the first half of the 1990s without any discernible effect on global trends. It is hard to exaggerate China’s weight in the world economy. But not impossible.
Given that so much of the optimism of Australia is based on the view that China (and India's) rise will continue long into the future, I'm not so sure that the impact on Australia would be so 'benign'. Australia would have benefited in the 1990s if Japanese demand had continued to expand. But I might just be a negative vibe merchant, with a vested interest in the concept of vulnerability!

For further commentary on this article see the always insightful Mark Thirwell on the Lowy blog site.

Monday, August 16, 2010

China Passes Japan as Second-Largest Economy

While this has long been mooted, it registers another milestone in the rise of China.

David Barboza in the New York Times reports.
Experts say unseating Japan — and in recent years passing Germany, France and Great Britain — underscores China’s growing clout and bolsters forecasts that China will pass the United States as the world’s biggest economy as early as 2030. America’s gross domestic product was about $14 trillion in 2009.
But as I've reported in earlier posts here and here, measuring the size of economies depends on whether we convert a country's GDP in the local currency to USD or use purchasing power parity (PPP) conversions.

On a PPP basis China has been bigger than Japan for quite some time.

According to Nicholas Lardy:
“It reconfirms what’s been happening for the better part of a decade: China has been eclipsing Japan economically. For everyone in China’s region, they’re now the biggest trading partner rather than the U.S. or Japan.”

The figures therefore say something about China, but also about Japan, which has been stagnating economically since the early 1990s.
But as I noted in The Vulnerable Country (ch. 3) China is still a poor country:
But while Japan’s economy is mature and its population quickly aging, China is in the throes of urbanization and is far from developed, analysts say, meaning it has a much lower standard of living, as well as a lot more room to grow. Just five years ago, China’s gross domestic product was about $2.3 trillion, about half of Japan’s.
This country has roughly the same land mass as the United States, but it is burdened with a fifth of the world’s population and insufficient resources.
Its per capita income is more on a par with those of impoverished nations like Algeria, El Salvador and Albania — which, along with China, are close to $3,600 — than that of the United States, where it is about $46,000.

Despite this, however, China is exerting more influence on the global economy:
Yet there is little disputing that under the direction of the Communist Party, China has begun to reshape the way the global economy functions by virtue of its growing dominance of trade, its huge hoard of foreign exchange reserves and United States government debt and its voracious appetite for oil, coal, iron ore and other natural resources.
China is already a major driver of global growth. The country’s leaders have grown more confident on the international stage and have begun to assert greater influence in Asia, Africa and Latin America, with things like special trade agreements and multibillion dollar resource deals.
“They’re exerting a lot of influence on the global economy and becoming dominant in Asia,” said Eswar S. Prasad, a professor of trade policy at Cornell and former head of the International Monetary Fund’s China division. “A lot of other economies in the region are essentially riding on China’s coat tails, and this is remarkable for an economy with a low per capita income.”
Regardless, China’s rapid growth suggests that it will continue to compete fiercely with the United States and Europe for natural resources but also offer big opportunities for companies eager to tap its market.


...

Although its economy is still only one-third the size of the American economy, China passed the United States last year to become the world’s largest market for passenger vehicles. China also passed Germany last year to become the world’s biggest exporter.
Global companies like Caterpillar, General Electric, General Motors and Siemens — as well as scores of others — are making a more aggressive push into China, in some cases moving research and development centers here.
Some analysts, though, say that while China is eager to assert itself as a financial and economic power — and to push its state companies to “go global” — it is reluctant to play a greater role in the debate over climate change or how to slow the growth of greenhouse gases.
China passed the United States in 2006 to become the world’s largest emitter of greenhouse gases, which scientists link to global warming. But China also has an ambitious program to cut the energy it uses for each unit of economic output by 20 percent by the end of 2010, compared to 2006.
Assessing what China’s newfound clout means, though, is complicated. While the country is still relatively poor per capita, it has an authoritarian government that is capable of taking decisive action — to stimulate the economy, build new projects and invest in specific industries.
That, Mr. Lardy at the Peterson Institute said, gives the country unusual power. “China is already the primary determiner of the price of virtually every major commodity,” he said. “And the Chinese government can be much more decisive in allocating resources in a way that other governments of this level of per capita income cannot.”


Sunday, May 9, 2010

Just How Big are the US, Japanese, Chinese, ASEAN, Korean and Australian Economies?

Percentage of World GDP and the Differences between PPP and USD Measurements

Table 1 shows relativities between countries on the basis of their percentage of the total global economy. It is measured on a current prices basis, which means that the measures are taken at the time and do not account for changing prices. Constant price GDP measures do account for inflation and measure GDP or GDP per capita using a base year, which is then used to measure ‘constant ‘prices. But for our purposes the failure to account for inflation doesn't matter because we're considering the percentage of the total at particular points in time.

Table 1 is constructed on a PPP basis. It shows that the United States’ percentage has fallen slightly but it remains the world’s largest economy by a long way. ASEAN has increased its share from 2.3 per cent of the world economy to 4.1 per cent. China’s growth has been the most dramatic, however, increasing from 2 per cent to 13.3 per cent. Japan’s percentage of the total has declined from 7.9 per cent to 5.9 and India has more than doubled its percentage from 2.2 per cent to 5.2 per cent, as has Korea from 0.8 per cent to 2 per cent.


Table 2 shows the percentage of world economic GDP accounted for by our countries of interest except this time on a US Dollar exchange basis. By this measure the developing countries and ASEAN are much smaller and the figures are profoundly affected by the USD exchange rate. Indeed as a percentage of global GDP ASEAN has not advanced its relative position very far at all, ASEAN accounted for 2.2 per cent in 1980 and 2.8 per cent in 2010. In 1985 at the height of the dollar in terms of its value, the US accounted for 35 per cent of global GDP. In 1995 at the height of the value of the yen, Japan accounted for 17.8 per cent of global GDP, falling to 8.5 per cent in 2010. Australia has advanced considerably, partly because of continuous growth since 1990 and partly because the AUD has increased in value since its low point in 2000.


Measuring the Size of Economies

A COMPARISON OF GDP

I just constructed these measurements for selected countries in Asia plus the US and Australia for the sake of comparison. The data is from the IMF. The measurements are for an Open University Course I'm writing called The Political Economy of East Asia. The course should probably be called The Political Economy of Power in East Asia but that's a bit too much of a mouthful. The particular module is called Rising Powers II: ASEAN and India.
Table 10.1 shows the relative size of all relevant economies for our course. It shows the continuing dominance of the US economy and the amazing growth of the Chinese economy since 1990. China will overtake Japan (on USD terms in 2010 – it passed it a while ago on PPP terms). Japan has done poorly since 1995, especially on USD terms as the value of the yen declined after the mid-1990s. On USD terms, the Japanese economy is roughly the same size it was in 1995! The table also shows just how well Australia has done since the 1990 recession.

The countries that make up ASEAN now grew rapidly between 1990 and 1995 but then contracted during 1995 and 2000, showing the major impact of the East Asian financial crisis. The figure for 2010 is an estimate, but is an estimate that factors in recent turmoil in the global economy. The figures were constructed for the April 2010 IMF World Economic Outlook Database.

India too has grown rapidly since 1990 from a smaller GDP on USD terms than Australia in 1990 to considerably larger in 2010.

Table 10.2 measures the size of our selected countries and ASEAN on purchasing power parity terms. It shows that on this basis ASEAN is much larger as is China and India. Indonesia is a considerably larger economy than Australia on PPP terms and ASEAN is nearly four times larger. None of our Asian countries, which contracted between 1995 and 2000 on an exchange basis, contracted when measured in this way. One of the impacts of the financial crisis was a sizeable decline in the se countries exchange rates in relation to the USD.


Sunday, March 14, 2010

Measuring Economic Weight

The Economist recently ran a story on putting the rise of Asia in perspective it's worth a read and is a useful corrective to many of the arguments that think the future is already here! The Balance of Economic Power: East or Famine The Economist.

There are two main ways to measure the size of economies. We can convert the value of Chinese gross domestic product (GDP), for example, into US dollars and compare it to the GDP of other countries. The advantage of this method is that it provides a neat comparison of a particular country with any other country at any particular time. But the problem with this measure is that it varies with the dollar–renminbi exchange rate and doesn’t accurately reflect the cost of things within the Chinese economy. If the renminbi was revalued this would immediately increase the measured size of the Chinese economy. This is not completely spurious because a higher valued renminbi would enable the Chinese to buy more goods and services on the international market and would increase their ability to invest in other countries. When exchange rates do vary considerably over time, such as the dollar–yen exchange rate since the 1970s, this method may be a problem. For example compare the difference in size of the Australian economy when measured at a time when the Australian dollar was 47.75c against the US dollar in April 2001 to when it reached 98.49c against the US dollar in July 2008. Although for measuring purposes the exchange rate is averaged over a period, variation still poses obvious problems.
Such discrepancies have led to the increased use of an alternative method of measuring the size of economies based on the concept of purchasing power parity (PPP). Statisticians measure purchasing power within individual economies and then makes comparisons on that basis. PPP measures GDP adjusted to reflect different costs of living and production within different economies. Goods and services and production costs are considerably less in China than they are in the United States. We all know that our currency goes further in some countries and less in others. You can live, for example, much more cheaply in Indonesia than you can in Sweden! A popular representation of PPP values is the Economist magazine’s tongue-in-cheek Big Mac Index, which compares the price of Big Mac’s around the world. A Big Mac in Sweden ($4.58) will cost you a lot more than a Big Mac in Indonesia ($1.74) or even the United States itself ($3.45). According to PPP theory, the cost of Big Macs should be the same across countries once local currencies are converted to US dollars. In these February 2009 prices, the Index suggests that the Swedish Kroner is overvalued against the dollar and the Indonesian rupiah is substantially undervalued. Big Macs are not really a good marker of PPP because they are generally considerably more expensive than local-food items in developing countries! There is also now an iPOD Index, which does the same thing, but with a high technology, tradeable item rather than a basic food item. This is significant because products that can be easily traded should, through the process of arbitrage, end up with the same price (allowing for exchange rates).

If we compare what a given amount of dollars will buy in the Chinese economy and compare it to what a given amount of dollars buys in the US economy we can, according to advocates of this approach, get a better idea of the size of an economy. The problem with this method is calculating the different costs of production and living on an ongoing basis. To do a proper analysis of PPP, the World Bank compares a large range of goods and services. It is very difficult to get a comparable basket of goods for diverse countries with substantially different cultures and consumption norms. In December 2007, the International Comparison Program co-ordinated by the World Bank revised down its PPP estimate of China’s economy by 40 per cent making a considerable difference to the measured size of the Chinese economy in 2005!

The best solution to the problem is the messy one of considering both measures together. Table 3.1 below shows that the United States accounted for 21.1 per cent of global GDP on a purchasing-power-parity basis in 2007, down from 23 per cent in 1995 and 24.5 per cent in 1980. China has rapidly caught up, accounting for 10.1 per cent in 2007 (revised down by the Bank by 6 per cent from earlier 2007 estimates!), up from 5.7 per cent in 1995 and 2.2 per cent in 1980. Measuring shares of global GDP by converting a country’s GDP to US dollars at market exchange rates produces very different results. On this basis, as Table 3.2 shows, in 2007 the United States was more than four times larger than China, accounting for nearly 25.3 per cent of global GDP, compared to 6.0 per cent for China. In 1995, according to this measure, the United States was 10 times larger than China. On an exchange basis, Japan’s relative position increased significantly between 1980 and 1995, with the increased value of the yen in the mid-1990s improving Japan’s position. On an exchange basis, Japan’s share of the world economy declined by half between 1995 and 2007. On a PPP basis, Japan’s economy has declined by a much smaller amount. These tables show that US decline has been gradual and that China’s rise has been mainly at the expense of Japan.
In 2006, the developing world accounted for more than 50 per cent of global GDP (measured on a PPP basis), signalling its growing importance. Developing countries grew at a faster rate between 1995 and 2005 than they did during the previous two decades and considerably faster than developed countries. In 2006, developing countries accounted for 43 per cent of world exports, up from 20 per cent in 1970; half of the energy consumption; and 70 per cent of currency reserves. Many see India as a major challenger to China’s mantle as the most important developing country. While China causes considerable anxiety in the developed world about its growing domination of manufacturing, India creates concerns because of its competitiveness in higher paid service and technology jobs. Outsourcing to India will increase in coming years and become even more important as a topic of debate.

But as The Economist reports:
Since 1995 Asia’s real GDP (even including less sprightly Japan) has grown more than twice as fast as that of America or western Europe. Morgan Stanley forecasts that it will grow by an average of 7% this year and next, compared with 3% for America and 1.2% for western Europe.
Yet a closer look at the figures suggests that the shift in economic power from West to East can be exaggerated. Thanks partly to falling currencies, Asia’s total share of world GDP (in nominal terms at market exchange rates) has actually slipped, from 29% in 1995 to 27% last year (see chart 1). In 2009 Asia’s total GDP exceeded America’s but was still slightly smaller than western Europe’s (although it could overtake the latter this year). To put it another way, the output of the rich West is still almost twice as big as that of the East.


As the graphic makes clear, Asia's (especially) China's growth is considerably more significant when it comes to measurements based on PPP. China's currency is kept artificially low and if allowed to rise China would increase its economic weight, but at the same time it would slightly undermine China's export growth potential as Chinese exports became relatively dearer on global markets.

So what about Asian exports? The Economist reports
the region’s 31% share of world exports last year was not much higher than in 1995 (28%) and remains smaller than western Europe’s. Indeed, the shift towards Asia appears to have slowed, not quickened. Its share of world output and exports surged during the 1980s and early 1990s. Although China’s share has grown since then, this has been largely offset by the decline in Japan, whose share of output and exports has halved.
A renewed emphasis on exports by the US could be an outcome of the economic crisis and the Obama administration aspires to doubling US exports in 5 years. (See "Can Obama Really Double Exports in Five Years?".) This doubling figure of course also requires some unpacking. It would be more meaningful if it meant a doubling of exports in comparison to the rise of GDP rather than a simple doubling of the USD figure.

What about the financial sphere?
Asian stockmarkets account for 34% of global market capitalisation, ahead of both America (33%) and Europe (27%). Asian central banks also hold two-thirds of all foreign-exchange reserves. That sounds impressive, but their influence over global financial markets is more modest, because official reserves account for only around 5% of the world’s total stash of financial assets. The bulk of private-sector wealth still lies in the West. The fact that Asian currencies make up only 3% of total foreign-exchange reserves indicates how far Asia still lags in financial matters.
While there is no doubt that on a PPP basis Asia has been expanding enormously, it's important to remember that Asia's international transactions are mainly conducted in USD. Asia (once again especially China) consumes considerably less than Western countries.
What really matters to Western firms is consumer spending in plain dollar terms. Although over three-fifths of the world’s population live in Asia, they only account for just over one-fifth of global private consumption, much less than America’s 30% share. But official figures almost certainly understate consumer spending in emerging Asia, because of the poor statistical coverage of spending on services. Figures from the Economist Intelligence Unit, a sister company of The Economist, suggest that Asia accounts for around one-third of world retail sales. Asia is now the biggest market for many products, accounting for 35% of all car sales last year and 43% of mobile phones. Asia guzzles 35% of the world’s energy, up from 26% in 1995. It has accounted for two-thirds of the increase in world energy demand since 2000.
Many Western firms are more interested in Asia’s capital spending than its consumption, and here Asia is undoubtedly the giant. In 2009, 40% of global investment (at market exchange rates) took place in Asia, as much as in America and Europe combined. In finance, Asian firms launched eight of the ten biggest initial public offerings (IPOs) in 2009 and more than twice as much capital was raised through IPOs in China and Hong Kong last year as in America.
Finally, The Economist, contains a graphic illustrating just how far Asia fell from its historical position of dominance up until 1800.


This graph, however, provides a lesson that The Economist, perhaps did not intend. Despite its continuing dominance of the world economy until the early nineteenth century, from the mid sixteenth century Europe - led by Spain and Portugal, followed by Holland and England - is clearly in the ascendancy. Gross economic weight is clearly not everything.