Showing posts with label US economy. Show all posts

Sunday, January 5, 2014

The US Economy in Three Charts and a Quote

I've long thought that the US economy would be the first major developed economy to emerge from the Great Recession, but the 'recovery' has been far from even. Wealth holders have fared best as profits and stocks have soared and wages stagnated. 

The NYT provides a series of graphs that it says explain the US in 2013. Here are three of them that explain why the US remains in severe trouble beneath the veneer of recent growth. 


In the last year, house values have increased benefitting investors and home owners. Business investment remains subdued, despite sustained low interest rates. 


In recent years, workers have not been benefitting from rising productivity. 


All in all, a mixed bag.  The US appears to be going through a new 'gilded age'. Social problems existing before the great recession and disguised by the general economic malaise in its aftermath are now being coated with a thin veneer of 'gold' - lucky for some. 

From Mark Twain novel The Gilded Age: A Tale of Today, written with Charles Dudley Warner, published in 1873.
Beautiful credit! The foundation of modern society. Who shall say that this is not the golden age of mutual trust, of unlimited reliance upon human promises? That is a peculiar condition of society which enables a whole nation to instantly recognize point and meaning in the familiar newspaper anecdote, which puts into the mouth of a distinguished speculator in lands and mines this remark: 'I wasn't worth a cent two years ago, and now I owe two millions of dollars.”

Tuesday, September 18, 2012

The World's Most Important Economic Relationship? US-China Trade and Investment

The economic relationship between the United States is one of the world's most important. The trade balance is considerably in China's favour and is matched by huge Chinese purchases of US debt securities. Although it has grown significantly in recent years, Chinese foreign direct investment (FDI) in the United States is still negligible at considerably less than one percent and US FDI in China constitutes about 10 per cent of the total.

While it is true that US-China trade as a percentage of China's total trade has been in decline over recent years, the United States and Europe (i.e. most of the developed market economies) remain key elements of final demand for products exported from China, but often sourced from other countries in Asia and from the United States itself.


The Trade Relationship

The trade relationship is marked by tensions as politicians in the United States seek to blame China for US economic woes. A Romney ad states: "It’s time to stand up to the cheaters and make sure we protect jobs for the American people." Meanwhile an Obama ad responds: "Romney’s companies were called pioneers in shipping U.S. manufacturing jobs overseas. He invested in firms that specialized in relocating jobs to low-wage countries like China. Even today part of Romney’s fortune is invested in China. Romney’s never stood up to China. All he’s done is send them our jobs."

Mutual suspicions about security issues increase the potential for economic conflict. But generally candidates are more critical during election campaigns, downplaying the rhetoric and action when in office.

US merchandise trade with China have grown markedly in importance since 1980 as the table below makes clear. [trade figures are generally divided into merchandise and services trade and services trade figures are often not included even though this is often unstated.]

The United States and China trades reestablished diplomatic relations and signed a bilateral trade agreement 1979, while most-favored-nation (MFN) status was granted in 1980.


In 2011 merchandise exports to China increased to $103.9 billion, up 13.1% over 2010 levels.  China is now the United States' 3rd most important export market, replacing Japan after 2007.


According to Morrison
From 2000 to 2011, the share of total U.S. exports going to China rose from 2.1% to 7.0%. The top five merchandise U.S. exports to China in 2011 were waste and scrap, oilseeds and grains, aircraft and parts, semiconductors and other electronic components, and motor vehicles  China is also a significant market for U.S. exports of private services, which totaled $21.1 billion in 2010 (the most recent year available), which was a 35.3% increase over 2009 levels, making China the seventh-largest export market for U.S. private services.
This means, according to the US-China Business Council (from Morrison) that the "total market for the sale of U.S. goods and services in China (i.e., U.S. exports and sales by U.S.-invested firms in China) could be as high as $200 billion annually." [For up-to-date statistics see the US Census Bureau Stats on Foreign Trade].

The Office for the United States Trade Representative reports that:
U.S. goods and services trade with China totaled $539 billion in 2011. Exports totaled $129 billion; Imports totaled $411 billion. The U.S. goods and services trade deficit with China was $282 billion in 2011. China is currently our 2nd largest goods trading partner with $503 billion in total (two ways) goods trade during 2011. Goods exports totaled $104 billion; Goods imports totaled $399 billion. The U.S. goods trade deficit with China was $295 billion in 2011. Trade in services with China (exports and imports) totaled $36 billion in 2011 (preliminary data). Services exports were $25 billion; Services imports were $11 billion. The U.S. services trade surplus with China was $13 billion in 2011.


While US exports to China have slowed in recent years in comparison to US trade with the rest of the world over the 10 years from 2002-2011 "U.S. exports to China increased by about 471% (the overall growth in U.S. exports over this period was 213.6%)."

According to the US-China Business Council, the United States was China's biggest trading partner and export market and the 4th biggest import source in 2010.


 However, while China is only the third largest export market for the United States, the US deficit with China is by far and away its biggest deficit.


This headline figure fuels the ire of American protectionists, but masks the extent to which China's 'exports' are re-exports from elsewhere. The iPhone provides a neat illustration of this distortion. According to Yuqing Xing
Using the total manufacturing cost $178.96 as the price of the iPhone, China’s iPhone exports to the US amounted $2.0 billion in 2009. Assuming that the parts supplied by Broadcom, Numonyx and Cirrus Logic, valued at $121.5 million, were imported from the US the iPhone alone contributed $1.9 billion trade deficit to the US, about 0.8% of the US trade deficit with China ...
But 
most of the export value and the deficit due to the iPhone are attributed to imported parts and components from the third countries and have nothing to do with China. Chinese workers simply put all these parts and components together and contributed only $6.50 to each iPhone, about 3.6% of the total manufacturing cost (e.g. the shipping price). The traditional way of measuring trade credits all $178.98 to China when an iPhone is shipped to the US, thus exaggerating the export volume as well as the imbalance. Decomposing the value added along the value chain of the iPhone manufacturing suggest that, of the $2.0 billion iPhone export from China, 96.4% is actually the transfer from Germany ($326 million), Japan ($670 million), Korea ($259 million), the US ($108 million) and others ($542 million). All of these countries are involved in the iPhone production chain.
If China’s iPhone exports were calculated based on the value added, i.e., the assembling cost, the export value as well as the trade deficit in the iPhone would be much smaller, at only $73 million, just 3.6% of the $2.0 billion calculated with the prevailing method.
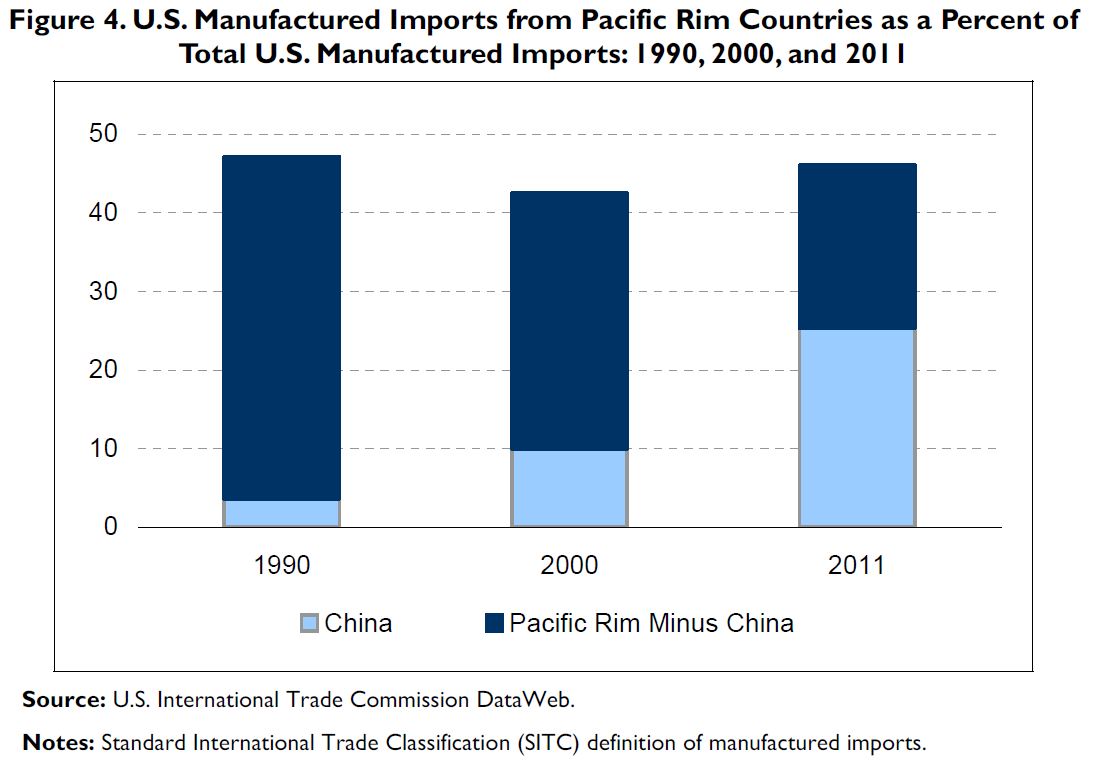
Morrison also points out that US trade with China has mainly replaced trade with other Pacific Rim countries. [Pacific Rim countries include Australia, Brunei, Cambodia, China, Hong Kong, Indonesia, Japan, South Korea, Laos, Macao, Malaysia, New Zealand, North Korea, Papua New Guinea, the Philippines, Singapore, Taiwan, Thailand, Vietnam, and several small island nations.] In terms of manufactured imports in 1990 47.1% of the value came from Pacific Rim countries (including China), while in 2011 the same countries accounted for 46.1% of the total.  US manufactured imports from China increased from 3.6% to 25.3% over the same period!


While the US-China trade relationship is an important component of each country's trade, the US does not have as much to lose as other countries if Chinese growth slows. Chinese imports make a significant contribution to growth of a wide range of countries, including Australia.


According to Mackenzie "0.6 percentage points of Germany’s 3 per cent GDP growth for 2011 — or, about a fifth — was courtesy of its exports to China ... There’s a certain irony here in that Germany is simultaneously importing less from some eurozone peripherals, to a degree that could be harming their prospects of recovery." For the United States "Chinese imports also contributed to 0.1 percentage points" of 1.7 per cent GDP growth in 2011, which while appearing like an insignificant number is actually "almost 6 per cent of US GDP growth."

When considered in terms of share of total exports, Australia is the second most Chinese-dependent economy in the world. And as I've argued before, the negative impact on Australia of a growth slowdown in China will be felt indirectly as well through the impact on our second and third largest export destinations Japan and Korea. (China accounted for 24.6%, Japan 16.7% and Korea for 8.0% of total exports in 2011)


Similar to Australia, US policy-makers and business people see great potential for future trade with China as it becomes richer and as a growing middle class demands more advanced goods and services. Morrison cites a 2009 Boston Consulting Group report arguing that "China had 148 million 'middle class and affluent' consumers, defined as those whose annual household income was 60,000 RMB ($9,160) or higher, and that level is projected to rise to 415 million by 2020."
Although Chinese private consumption as a percent of GDP is much lower than that of most other major economies, the rate of growth of Chinese private consumption has been rising rapidly. For example, private consumption as a percent of GDP in China in 2011 was 34.0%, compared to 71.1% in the United States. However, the annual rate of growth in Chinese private consumption from 2002 to 2011 averaged 8.0%, while the U.S. annual average was 1.9%. 

The Investment Relationship

The investment relationship is also very significant for both countries and the wider world. A majority of Chinese investment in the United States is in public and private securities (including, according to Morrison, U.S.Treasury securities, U.S. government agency (such as Freddie Mac and Fannie Mae) securities,
corporate securities, and equities (such as stocks)." U.S. Treasury securities "are the largest category of U.S. securities held by China". Most US investment in China is foreign direct investment (investment of greater than 10 per cent in a company).

China's holdings of Treasuries "increased from $118 billion in 2002 to $1.15 trillion in 2011", although holdings declined by 0.7% in 2011. China replaced Japan as the largest holder of Treasury securities in 2008.


There is considerable debate about whether this ownership of treasuries gives China influence over China or whether it signals a so-called balance of financial terror. I've written before about these claims here and here, based on the work of Michael Pettis. To summarise, such claims are overblown. As Pettis points out: 
As long as China maintains its own currency and denominates all domestic transactions in RMB, the PBoC reserves cannot be used in China. They cannot go to pay doctors’ salaries, to build bridges, to lower taxes or to subsidize consumption. They can only be used to purchase or pay for things from outside China. This means that reserves ensure that China can import foreign commodities and other goods as long as it can pay for them domestically. It also means that the PBoC can ensure the availability of dollars to repay foreign debt and foreign investment.  ...
The US government does not need foreign buyers for its bonds. On the contrary, it is in Washington’s best interest that foreign central banks sharply reduce their purchases of USG bonds.
According to Murray and Labonte foreigners owned 56.9% of federal govt debt at the end of 2011, up from 53.5% at the end of 2007.

China holds the largest percentage with 23.1 per cent, followed by Japan with 21.2 per cent. The Luxembourg and Caribbean Banking centres are probably fronts for Middle Eastern buyers and Hedge Funds and in the past China has bought Treasuries through companies operating out of London.


Compared to the amount of foreign investment in securities FDI between the two countries is very small.

The Office of the United States Trade Representative reports that:
U.S. foreign direct investment (FDI) in China (stock) was $60.5 billion in 2010 (latest data available), a 21.4% increase from 2009. U.S. direct investment in China is led by the manufacturing and banking sectors. China FDI in the United States (stock) was $3.2 billion in 2010 (latest data available), up 171.6% from 2009. China direct investment in the U.S. is led by the wholesale trade sector.
The total stock of FDI in the US in 2010 according to UNCTAD's 2012 World Investment Report was $3,397 billion, which means that the stock of Chinese FDI in the United States as a percentage of the whole was 0.09%.

According to Morrison, the Bureau of Economic Affairs (the US equivalent to the ABS) adds FDI from China and for China through offshore centres such as Hong Kong and designates this calculation the “ultimate beneficial owner” (UBO) of FDI. This increases the amount of "China’s cumulative FDI flows to the United States through 2010 by 86% to $5.8 billion."

If we use this enhanced figure it means that China's percentage of  total FDI was 0.17% in 2010.

Even this UBO figure "would rank China as the 30th-largest source of total FDI in the United States through 2010.
The Rhodium Group (a private research consultancy and advisory company) estimates cumulative Chinese FDI flows to the United States through the end of 2010 at $11.7 billion and that the amount of new Chinese FDI in the United States in 2010 was $5.2 billion. 
Accepting this higher figure would mean that, like Australia, recent increases in Chinese FDI in the United States are significant but from a very low base. To put the US figure in context, the total stock of Chinese FDI in Australia at the end of 2011 was AUD13.3 billion.

US FDI in China ($60.5) billion as a percentage of the total stock in 2010 ($587.8 billion) was 10.3% of the total.


Conclusion

There is no doubt that Asia has outperformed the rest of the world over recent years. But the pertinent question to ask is whether it can continue to perform well if growth stays anaemic in Europe (the world's most important economic region), the United States (the world's largest economy) and Japan (the world's third largest economy). As Michael Pettis argues in his latest newsletter, what the world needs form China at the moment is not more growth, but more net demand.

A rebalancing Chinese economy that grows at a slower rate but a shift in wealth towards households will be good for the United States, but perhaps bad for Australia.


Tuesday, April 3, 2012

Europe, China, the United States: What Balance and Whose Payments?

It might be a little bit dorky, but one of my favourite times of the month is the arrival of Michael Pettis's newsletter China Financial Markets. This rather blandly titled missive always provides rational, well argued and interesting comment on the Chinese economy.

Pettis constantly rails against those who don't understand the basic accounting concepts of the balance of payments.

In October last year in relation to the possibility that China could help with Europe's debt problems, he argued that:
Europe does not need capital from foreigners. It is capital rich. In fact it is even a net exporter of capital. The reason certain European governments cannot borrow is not because Europe is capital poor. It is because these countries are perceived to be insolvent, and in altogether too many cases they almost certainly are. 
Bailing out an insolvent government cannot help it. It will give it time to work out its problems, many argue, but the historical precedents suggest that the quicker an insolvent country acknowledges its insolvency and demands debt forgiveness, the better off it is in the longer term. 
... an increase in foreign money inflows actually will make Europe’s problems worse. Europe needs more demand, not more foreign money. More foreign demand is the opposite of more foreign money.
Remember that a net increase in foreign capital means that foreigners are importing demand from Europe. But Europe needs them to export demand to Europe. More foreign capital inflows is exactly the wrong thing – and in fact what Europe really needs is to increase its exports of capital. Paul Krugman, by the way, makes almost exactly the same point when he says: “It is very difficult in real time to convince people that capital inflows pose a threat, no matter how obvious the numbers seem." 
But difficult or not, it is important that policymakers grasp this point and it is important that investors understand the consequence when policymakers fail to grasp it. The trade and currency wars that we are experiencing are nothing more than wars about exporting capital. Exporting capital is exactly the same as importing demand. Every country that wants to run a trade surplus is also by definition a country that wants to export capital. 
And of course every country that accepts net foreign capital inflows must also accept a trade deficit (or, more correctly, a current account deficit). This isn’t a theory. It is an accounting identity.
This sort of reasoning is counter-intuitive to many people. Some of my more knowledgeable students look incredulously when I argue that the United States would actually benefit from a decline in Chinese purchases of US Treasury securities because it is popular wisdom that China holds all the power now that the US is so indebted to Chinese borrowers.

For what its worth, I've always thought that the fact that China lends to the United States at low rates of interest (i.e. bonds) and then uses some of that money to invest to earn higher rates of interest in China was a good deal for the United States and an indicator of Chinese weakness rather than strength. The only problem with this view is that the increased liquidity created by Chinese purchases of US dollar assets was an important factor in the global and US financial crisis. But as Pettis makes clear, Chinese investment in the United States does provide an advantage for China in that it exports capital to and therefore imports demand from the United States. To be blunt, the balance of power in this situation is far from clear.

Pettis has repeatedly pointed out that many people fail to understand this balance of payments logic in regards to the US-China relationship.From his October 31st 2011 newsletter he writes:
Non-economists may think China, with its huge reserves and 9% GDP growth can weather a trade war more effectively than the US. For example in an otherwise interesting article in the South China Morning Post, Lanxin Xiang, a professor of international history and politics in Geneva, says the following:
China owns too many US government bonds and yet the central bankers have always discouraged the government from entertaining any thought of using them as diplomatic leverage in dealing with Washington. But throughout modern world history, using monetary instruments to achieve diplomatic aims is the norm rather than exception. One notable case was the Suez Canal crisis, when Washington threatened to stop market support for sterling to force the British withdrawal from the Anglo-French colonial expedition against Egypt's nationalist president Gamal Nasser. 
I believe Xiang has used the Suez Canal crisis argument before, and it is a very clumsy analogy. The UK desperately needed to import capital from the US in those days to support sterling, whereas today the US is eager to get China to stop exporting capital (there is, remember, no difference between intervening to weaken a currency and exporting capital, and Washington clearly wants China to reduce its intervention). It isn’t likely that a threat by the US to stop exporting capital in the former case is as credible as a threat by China to stop exporting capital in the latter case, but of course this is the kind of mistake that many who don’t understand central banking or the balance of payments mechanism make over and over again.
In fact most economists (economic historians and trade economists, anyway) know that trade wars usually switch demand from surplus countries to deficit countries. Instead of hurting the deficit countries, this actually causes faster growth in the latter, albeit at the expense of slower growth in the former. Trade and currency war, in other words, is bad for the world but not necessarily bad for the deficit countries.  
The thing to note here is that Chinese capital outflows involve the export of demand from the United States and therefore an increase in unemployment in the United States. An orderly fix of the global imbalances (see here for a 2010 discussion) will be required if the world is to avoid an eventual trade war. This means adjustments on both sides of the question, but if China continues to pursue an investment and export-led growth model its current account surpluses must be matched somewhere with current account deficits. The United States has been this major deficit country.

In Europe, Germany's surpluses have been matched by Spain's deficits. Australia also is a major deficit country, although our current account deficit has declined as domestic saving has increased and non-mining investment has moderated.

Pettis makes the point that China's lending to the United States is not a discretionary decision, instead it is a fundamental consequence of its growth model. From his January 8th 2012 newsletter he writes:
Chinese “lending” to the US government is not a discretionary decision that they can choose or not choose to do – it is the automatic consequence of a growth model that requires a trade surplus to absorb domestic overcapacity – the idea that the US government needs foreign funding is based on a very fundamental misunderstanding of the balance of payments.  The US government does not need foreign buyers for its bonds. On the contrary, it is in Washington’s best interest that foreign central banks sharply reduce their purchases of USG bonds.
He also highlights the need to make distinctions between 'deficits':
foreigners do not fund fiscal deficits. They fund current account deficits, and as an accounting requirement the size of the current account deficit is exactly equal to the net foreign funding. Capital account inflows must exactly match current account outflows. 
The direction of causality can go either way. If investment in the US is so high, for example, that it is impossible for US savings to supply the full demand (as occurred during much of the 19th Century), then the US must import foreign capital to make up the shortfall. The difference between domestic US investment and domestic US savings, of course, is equal to the net amount of foreign savings imported into the US, and is also equal to the US current account deficit. In this case soaring US investment causes the US to have a current account deficit and leads foreigners to fund this excess investment.
This has some relevance to Australia because we have historically had an excess of investment over saving meaning that we generally run a current account deficit. This is not necessarily a bad thing if the investment is productive. That's a big 'if' and much of the foreign capital inflow into Australia involved household borrowing to buy (and, to a lesser extent, to build) houses, thus bidding up the prices of houses. This game has seemingly finished for the moment at least, partly because the household sector has such high levels of debt at around 150 per cent of disposable income (down from 160 per cent a few years ago).

Note that Pettis makes the point that the direction of causality between saving and investment and between capital exports and imports are not always clear cut. 
But the direction of causality can also run the opposite way. Suppose foreign central banks have decided for domestic reasons (for example in order to generate domestic employment) to accumulate hoards of US government obligations and so run a trade surplus. This will cause a surge of net capital inflow into the US. In that case the US must run a current account deficit equal to the net inflow.
There are several ways this can happen. One way is for the surge in foreign capital inflows to cause a sharp rise in what otherwise would have been unnecessary or unfunded investment – the real estate bubbles in Spain and the US might be obvious examples of this. Another way is for foreign savings to displace domestic savings, perhaps by funding a credit-fueled consumption boom.
But whether for good reasons or bad reasons there is no escaping the fact that net capital imports into the US, whether pulled by domestic needs or pushed by foreign needs, must be accompanied by a rising US current account deficit – this is just arithmetic. ...
Remember that saying that the US needs more foreigners to buy US government bonds in order to keep interest rates low is exactly the same as saying the US needs a bigger current account deficit in order to keep interest rates low. This cannot be true.
In a recent newsletter (20 March 2012) Pettis makes some astute observations about China and the way that many commentators assume that the Chinese leadership can fulfil their intentions. He argues that this is because they focus on intentions rather than constraints.
This failure to focus on constraints rather than intentions is why I think most analysts have gotten China wrong in the past five years. By misunderstanding how China’s growth model works, and how the functioning of the model forces certain kinds of behavior and prevents others, they have been much less skeptical about Beijing’s ability to execute its intentions than they should have been. I think we should be much less impressed by what the leaders say they will do, and much more concerned about how the constraints they face will limit what they actually can do.
This applies not just to China, but for any country and particularly Europe right now:
This is an issue not just for China, by the way, but for any country. For example, knowing the constraints imposed by the functioning of the balance of payments I am wholly unimpressed by what many senior German and European leaders say they expect to happen in Europe. The fact is that if we hope to see net repayments by peripheral Europe to Germany, we will also have to see a reversal in their respective current account positions, and so far this seems unlikely. Without the latter, however, the former is impossible, no matter how determined Madrid, Rome, Berlin and Paris might be to reduce debt in an orderly way.

So what are the economic options available to the Chinese leadership given both internal and external constraints?

Pettis argues that two initial assumptions are necessary.
The first is that the fundamental imbalance in China is the very low GDP share of consumption. This low GDP share of consumption, I have always argued, reflects a growth model that systematically forces up the savings rate largely by repressing consumption, which it does by effectively transferring wealth from the household sector (in the form, among others, of very low interest rates, an undervalued currency, and relatively slow wage growth) in order to subsidize and generate rapid GDP growth.
The consequence of this is that investment levels must be kept very high. The question is how much investment can the Chinese government continue to make beyond the historically highest levels for any country ever!

According to Pettis this has "resulted in massive over investment and an unsustainable increase in debt. China cannot slow the growth in debt and resolve its internal economic problems without raising the consumption share of GDP."

Pettis's second assumption is that some sort of rebalancing in China is inevitable because its imbalances "cannot get much greater".
The first reason is the debt dynamics. Every country that has followed a consumption-repressing investment-driven growth model like China’s has ended with an unsustainable debt burden caused by wasted debt-financed investment. This has always led either to a debt crisis or to a “lost decade” of very low growth.
At some point the debt burden itself poses a limit to the continuation of the growth model and forces rebalancing towards a higher consumption share of GDP. How? When debt capacity limits are reached, investment must drop because it can no longer be funded quickly enough to generate growth. When this happens China will automatically rebalance, but it will rebalance through a collapse in GDP growth, which might even go negative, resulting in a rising share of consumption only because consumption does not drop as quickly as GDP.
Pettis quickly points out that he is not suggesting a sudden China collapse, rather he is suggesting that re-balancing must occur eventually either in an orderly or disorderly fashion. It is debt that will eventually force China to re-balance.

Now it is at this point that some students ask me (the good ones I mean) why can't China use the huge amount of reserves it has to pay off its internal debts?

Once again the explanation requires some knowledge of the balance of payments and reserve banking - not every politics student's favourite topics! Instead of making an already complicated post even more complicated, I've provided an explanation here.

The real question about rebalancing is not that it will happen but when. Betting against China or assuming that its growth model is doomed once again reminds me of Keynes's reputed observation about the ability of markets to remain irrational for longer than individuals can remain solvent. Lots of scholars and investors have assumed and bet that China was destined to fail, but it ain't happened yet. Pettis canvasses the more positive arguments:
China bulls continue to argue that there isn’t yet a significant overinvestment problem in China, which implies that debt is not rising at an unsustainable pace, or if it is, that it can continue rising for many more years before the debt burden itself becomes unsustainable.
This also implies that the consumption imbalance is temporary and can resolve itself gradually and over time as the benefits of earlier investment begin to emerge and eventually overwhelm the total costs of those investments. Of course if this is true China does not need a surging current account surplus because if investment isn’t being wasted it can keep investment rising faster than savings for many more years. The current account surplus, remember, is just the excess of savings over investment. 
The key vulnerability of my argument, then, is whether or not you think investment in the aggregate is being misallocated in China and has been for many years. If you agree, then you must also agree that consumption must become a greater share of GDP over the next five to ten years. What’s more, you should also agree that the only way to increase the consumption share of GDP is to increase the household income (or wealth) share of GDP.
China, in other words, must stop transferring income from households to the state and in fact must reverse those transfers. As Chinese household income and wealth become a greater share of the overall economy, so will Chinese consumption. As I see it, the various ways in which this transfer can take place can all be accounted for by one or more of the five following options:
1.Beijing can slowly reverse the transfers, for example by gradually raising real interest rates, the foreign exchange value of the currency, and wages, or by lowering income and consumption taxes.
2.Beijing can quickly reverse the transfers in the same way. 
3.Beijing can directly transfer wealth from the state sector to the private sector by privatizing assets and using the proceeds directly or indirectly to boost household wealth. 
4.Beijing can transfer wealth from the state sector to the private sector by absorbing private sector debt. 
5.Beijing can cut investment sharply, resulting in a collapse in growth, but it can mitigate the employment impact of this collapse by hiring unemployed workers for various make-work programs and paying their salaries out of state resources.
Notice that all of these options effectively have China doing the same thing: In each case the state share of GDP is reduced and the household share is increased. There are however very big differences in how the changes are distributed among various parts of the household sector and the state sector. 
Different rebalancing scenarios have very different implications for growth and distribution. For Pettis, the real costs of rebalancing must fall on the state sector.
Remember that for the past twenty years, and especially in the past ten years, the state and business share of a rapidly growing economic pie was also growing, which meant extraordinary growth in the value of assets controlled by the state sector. The household share of the growing economic pie of course contracted, but the rapid growth in the pie ensured that households nonetheless saw their income grow quite rapidly even as their share of total income declined.
When we reverse this process, as we must if there is to be rebalancing, any slowdown in GDP growth will be minimally felt by the household sector (if the rebalancing is managed in an orderly way), but even a scenario of very high GDP growth must result in much slower growth in the value of state sector income and assets. Of course if GDP growth actually slows sharply, which I expect it will, the growth in the value of state sector assets will collapse and perhaps even turn negative. 
In my opinion this change in the growth rate of the state sector will be at the heart of the political economy choices, and difficulties, that Beijing will be forced to address in the nest few years. It is likely to be much easier to keep political leaders happy when the value of the state sector is growing comfortably in the double-digit range than it is when it is growing in low single digits, or even contracting.
The issue then, according to Minxin Pei, is whether the CCP will be 'happy' to let this happen. Pettis discusses economic constraints, whilst Pei talks about political constraints. Pettis goes through the positives and negatives of all the options outlined above:
As I see it these are ultimately the only options – or at least the major set of options – Beijing can choose to follow over the next few years if it wants to avoid a debt crisis. Of course Beijing doesn’t have to choose only one of the above options. What is more likely in fact is that policymakers end up choosing a combination. 
For example we can posit the following. Beijing can choose an intermediate path between the first and second options, and raise interest rates sharply over the next two or three years while also raising the value of the RMB by 10-15% in an overnight maxi-revaluation. 
In order to protect workers from the resulting surge in unemployment, Beijing can instruct state-owned companies and local governments temporarily to hire a huge number of workers for make-work programs (the fifth option) and initially pay for this by increasing borrowing (the fourth option). At the same time it can begin a massive program of privatization, which should include transferring ownership of land to peasants, and selling off assets and using the proceeds to shore up the social safety net and to pay down debt in the banking system. 
This would certainly work economically to rebalance China in a way that guarantees fairly high growth rates over the rest of the decade, but is it politically possible? Here I would defer to Minxin Pei, who might argue that the scale of privatization required is not possible politically. In that case China would end up being forced into rebalancing via the fourth option, with a long-term surge in government debt. 
And this is my point. If you believe my assumptions are correct, then you should agree that China has no choice but to follow one or more of these paths. If privatization is not an option, then a collapse in the economy caused by a rapid adjustment in interest rates and the currency (the second option) might be. If that is ruled out, then perhaps the outcome will be a surge in government debt (the fourth option again), and so on. 
This what I mean by the economic constraints that limit the choices Beijing can make. It doesn’t matter what anyone thinks or wants Beijing to do, if the plan violates the economic constraints, it cannot be done. To be really complete we should outline the political constraints, the environmental constraints, the demographic constraints, the external trade constraints, and so on, although of course this is way beyond my ability, but each of these exercises allows us to escape from the confusion of stated intentions and to focus on the possible.
Interesting times ahead. 


Thursday, February 16, 2012

The Australian Economy in 2012


When the world economy recovered strongly in 2010, many commentators believed that the great recession was over. In Australia, we still have commentators who fully dismiss that there was any need for action to bolster the Australian economy during 2008 and 2009. This is despite the fact that government guarantees kept the banks afloat (no thanks from the banks for that now), the Reserve bank's monetary stimulus bolstered mortgagees' spending power and Treasury's fiscal stimulus bolstered confidence just at the right time.If you have a look at the graph below you will see that the world economy contracted during this period - an unusual event - and the Australian economy did not.

Successful fiscal stimulus is a bit like averting a terrorist attack. People don't really appreciate what might have been if the action to avert the problem had not been taken.
The subsequent reinvigoration of the Chinese economy through government action also acted to bolster the economy further in 2010, making many people argue that there was no value in the building of school facilities that followed. Anyone who has a child at school or goes to a university will realise that there have been some marvellous facilities built that will benefit students far into the future. The Building the Education Program may have been rushed and it may not have been an effective form of fiscal policy, but it was in the main an effective piece of infrastructure development in Australia.

One building company owner in South Australia made it clear to me that without the prospective work, layoffs would have been significant in his company. So we've been doing fairly well, despite some real and significant problems associated with structural change in the Australian economy.

The Reserve Bank is a prolific publisher of research and its key figures regularly give speeches on the state of the Australian and world economies. Phillip Lowe, the Deputy Governor, gave a speech this morning on "The Forces Shaping the Economy Over 2012.

The first thing to note is that the world economy is expected to do worse than thought in September 2011. Most forecasts have been revised downwards in recent times.


But compared to 2009, this is still a good performance. Europe remains the major problem. According to Lowe:
Working through the various challenges is taking the Europeans time. The process has been frustratingly slow and we have witnessed some missteps along the way. But for all of that, we should not lose sight of the fact that progress is being made. Late last year there was a palpable sense that something might go badly wrong over our summer. Clearly, that has not happened. Instead, government bond yields for some of the troubled countries in Europe have declined a little (Graph 2). Equity markets have picked up and confidence has improved a bit. And significantly, bank debt markets are functioning again, although the cost of issuing bank debt, relative to government yields, is higher than it was in the middle of last year.


Lowe notes that one of the problems for 2012-13 is the fact that many countries are undergoing fiscal consolidation at the same time, providing a significant drag on growth, although he doesn't want to sound too much like a booster.  
Over 2012 and 2013, fiscal policy is set to be quite contractionary in both Europe and the United States as governments attempt to put their public finances on a sounder footing. Indeed, the aggregate fiscal contraction across the advanced economies is likely to be the largest seen for many decades. This is not because the size of the fiscal consolidations in individual countries is unprecedented, but rather because the consolidations are occurring simultaneously in a large number of countries. Unusually, they are also taking place in an environment where output in the affected countries is considerably below potential.

The economic literature is mixed on the effects of fiscal consolidation on growth. There are certainly some examples where consolidation has been associated with fairly strong GDP growth. But in most of these examples, the countries undertaking the fiscal consolidation have benefited from some combination of robust growth in their trading partners, an easing of monetary policy and a depreciation of their exchange rate. Given the nature of the current situation, it is unlikely that the advanced economies, as a whole, can benefit from these factors. There is therefore a material risk that fiscal consolidation weakens growth in the short run, which leads to more fiscal consolidation in order to meet previously announced targets and, in turn, yet weaker growth. We are currently seeing this dynamic play out in a couple of the countries in southern Europe. If it is not to be repeated on a wider scale, the fiscal consolidation in the North Atlantic economies will need to be accompanied by reforms to the supply side that lift the underlying rate of growth of these economies.
In other words widespread fiscal contraction provides a big risk of a negative spiral and a long period of stagnation. All of which is going to be exacerbated by continuing household and wider private sector deleveraging.

The US is increasingly being seen more positively, but it might be too early to open up the champagne just yet.

The US is paying off debt more quickly than many other countries as a recent McKinsey report noted.
Household debt outstanding has fallen by $584 billion (4 percent) from the end of 2008 through the second quarter of 2011 in the United States. Defaults account for about 70 and 80 percent of the decrease in mortgage debt and consumer credit, respectively. A majority of the defaults reflect financial distress: overextended homeowners who lost jobs during the recession or faced medical emergencies found that they could not afford to keep up with debt payments. It is estimated that up to 35 percent of the defaults resulted from strategic decisions by households to walk away from their homes, since they owed far more than their properties were worth. This option is more available in the United States than in other countries, because in 11 of the 50 states—including hard-hit Arizona and California—mortgages are nonrecourse
The report argues that the US is further down the path of deleveraging than Spain or the UK, but the default part of the equation is perhaps no reason to be jumping for joy. McKinsey bases their assumption on a historical trend line of increasing debt and argue that the US may be half way through the deleveraging process.


But think about it this is a trend line from 1955. Eventually the trend line will reach 130% of GDP, perhaps by 2040, which would mean deleveraging during the 2050s could involve a decline from an above trend 140% of GDP ... or whatever. The point is the assumption of an ever-expanding trend line is a furphy. Credit really takes off in the early 1980s with financial liberalisation and the massive expansion of credit that followed. Believing the trend line would mean accepting that eventually. perhaps by 2100, that household debt at 200% of GDP was sustainable.

Comparison with deleveraging in Sweden after their severe financial crisis is quite illuminating. It also makes clear that the UK and Spain also have a long way to go before their episodes of deleveraging are finished.


But anyway the report is well worth a read, just to see why this period of economic stagnation may be a long one. For a look at some comparable figures on Australian household debt see here.

Lowe downplays the impact of China  in the speech:
The Chinese economy is also continuing to grow solidly. The pace of growth has slowed, but it has done so in line with the authorities’ intentions. Inflation in China has also moderated. Across the rest of east Asia, the recent data have been mixed. Nevertheless, for the region as a whole, growth in 2012 is expected to be around trend, with domestic demand likely to play a more important role in generating growth than it has for most of the past two decades.
Let's hope his anodyne assessment is correct.

Lowe then moves to the Australian economy and notes the significance of the once in a lifetime investment that is happening right now.

As you can see from the graph the projected level of investment is huge, belying the regular scare-mongering from the resources sector.

But as many of you will now know this investment has been heavily concentrated in the resource sector and is part of the equation leading to a higher exchange rate.
 

I used to amuse students with stories of the Australian dollar at around 1.50, which seemed rather ridiculous at the turn of the millennium when it hovered around 50%.

Given the importance of the RBA in managing the Australian economy it is worthwhile considering how they see these developments.
The effects of the high exchange rate are evident in the manufacturing, tourism and education sectors, as well as some parts of the agriculture sector and, more recently, in some business services sectors. With the exchange rate having been high for some time now, more businesses are re-evaluating their strategies, as well as their medium term prospects. In some cases, this is prompting renewed investment to improve firms’ international competitiveness. But in other cases, businesses are scaling back their operations in Australia and some are closing down. These changes are obviously very difficult for the firms and individuals involved.  

Both the investment boom and the very high level of the exchange rate are historically very unusual events. This makes it difficult to assess their net effect. It seems, however, that over the past year these forces have balanced out reasonably evenly. 
In other words, don't worry, be happy. While it was slightly cool to be a pessimist before the crash it's now much cooler to be an optimist as a range of recent articles and books have pointed out.


Tuesday, February 7, 2012

Debt, Inequality and Financial Crises

Paul Krugman is a figure of hate for the right in American politics. He is a liberal in the American sense of the word. But he is also an intelligent economic liberal, which means that he realises the benefits of markets and the necessity of government intervention.

In a recent blog post he counters views that he only talks about the Bush property bubble, while ignoring the Clinton stock bubble.
Except I did. Actually, back then the WSJ editorial page was flogging Dow 36,000 and telling readers that anyone who had doubts about the level of stock prices must hate capitalism.
Beyond that, there are some real differences between the Bush and Clinton bubbles.
One is that Bush presided over only four years of job growth, 2003-2007 — and those were all bubble-driven years. Clinton presided over eight years of job growth, with job growth at roughly equal rates in the first and second halves of that eight-year period, and the Internet bubble inflated only in the second half.
Another difference, which is really crucial, involves the debt implications. Here’s non financial debt, public plus private, as a percentage of GDP.

Have a look at those years of debt growth and which Presidencies they are associated with. 

One of the arguments that I find most interesting about the growth of debt, beyond the significance of financial liberalisation, is the clear association of increasing debt with income stagnation.

During a period of income stagnation households increase their level of debt to maintain their living standards or to keep up with new consumption norms (often based on the consumption patterns of those on upper income levels).

Another interesting argument is that higher inequality might, therefore, be an important factor in creating the conditions for financial crises.

Michael Kumhof and Romain Rancière in Finance and Development argue that
Long periods of unequal incomes spur borrowing from the rich, increasing the risk of major economic crises.
The United States experienced two major economic crises over the past 100 years—the Great Depression of 1929 and the Great Recession of 2007. Income inequality may have played a role in the origins of both. We say this because there are two remarkable similarities between the eras preceding these crises: a sharp increase in income inequality and a sharp increase in household debt–to-income ratios.

Kumhof and Rancière argue that there are two major policy options for governments to deal with high levels of household indebtedness.

There are two ways to reduce ratios of household debt to income.

The first is orderly debt reduction. What we have in mind here is a situation in which a crisis and large-scale defaults have become unavoidable, but policy is used to limit the collateral damage to the real economy, thereby leading to a smaller contraction in real economic activity. Because this implies a much smaller reduction in incomes for any given default on loans, it reduces debt-to-income ratios much more powerfully than a disorderly default. Still, a long-lasting trend toward higher debt-to-income ratios resumes immediately after the debt reduction, because workers continue to have a reduced share of the economy’s income.
The second possibility, illustrated in Chart 4, is a restoration of workers’ earnings—for example, by strengthening collective bargaining rights—which allows them to work their way out of debt over time. This is assumed to head off a crisis event. In this case, debt-to-income ratios drop immediately because of higher incomes rather than less debt. More important, the risk of leverage and ensuing crisis immediately starts to decrease.

Any success in reducing income inequality could therefore be very useful in reducing the likelihood of future crises. But prospective policies to achieve this are fraught with difficulties. For example, downward pressure on wages is driven by powerful international forces such as competition from China, and a switch from labor to capital income taxes might drive investment to other jurisdictions. But a switch from labor income taxes to taxes on economic rents, including on land, natural resources, and financial sector rents, is not subject to the same problem. As for strengthening the bargaining power of workers, the difficulties of doing so must be weighed against the potentially disastrous consequences of further deep financial and real crises if current trends continue.
Restoring equality by redistributing income from the rich to the poor would not only please the Robin Hoods of the world, but could also help save the global economy from another major crisis.
It certainly makes intuitive sense, irrespective of the economic modelling.  Mix easier access to credit with stagnating incomes and a culture of conspicuous consumption and you have a major factor in why the developed world is in crisis at the moment.

It also returns to my long-standing point that Australia's greatest generally unremarked vulnerability is our vulnerability to rising inequality. 


Inequality, not just poverty, does matter, and research like that above makes clear that it presents real dangers to economies as well as societies.


Monday, August 22, 2011

US Inequality in a Nutshell

The difficulties of doing something about inequality  in the United States are numerous, but as Paul Krugman once said the explanations for inequality are more sociological than economic. Globalisation or economic openness are not responsible even if they provide persuasive arguments to explain why rising inequality is inevitable.

If governments want to do something about inequality they could, but they would require popular support to do so. At what point does rising inequality in the US cause a rethink amongst the population that political interventions are required to lower inequality instead of increasing it?

Unfortunately for egalitarians, the economic crisis has led to a right-wing populist backlash against government, rather than a left-wing populist backlash against corporations and the wealthy.


One of the richest men in the world Warren Buffett has written an excellent article in the NYT called "Stop Coddling the Super-Rich".

Buffett wonders why the rich haven't shared in the necessary sacrifices required to deal with the economic crisis.
OUR leaders have asked for “shared sacrifice.” But when they did the asking, they spared me. I checked with my mega-rich friends to learn what pain they were expecting. They, too, were left untouched.
While the poor and middle class fight for us in Afghanistan, and while most Americans struggle to make ends meet, we mega-rich continue to get our extraordinary tax breaks. Some of us are investment managers who earn billions from our daily labors but are allowed to classify our income as “carried interest,” thereby getting a bargain 15 percent tax rate. Others own stock index futures for 10 minutes and have 60 percent of their gain taxed at 15 percent, as if they’d been long-term investors.
The most appalling fact is that the rich get these benefits at the expense of middle class and poor workers.
Last year my federal tax bill — the income tax I paid, as well as payroll taxes paid by me and on my behalf — was $6,938,744. That sounds like a lot of money. But what I paid was only 17.4 percent of my taxable income — and that’s actually a lower percentage than was paid by any of the other 20 people in our office. Their tax burdens ranged from 33 percent to 41 percent and averaged 36 percent.
Buffett argues that higher taxes would not stop investment as many corporations and financiers argue.
Back in the 1980s and 1990s, tax rates for the rich were far higher, and my percentage rate was in the middle of the pack. According to a theory I sometimes hear, I should have thrown a fit and refused to invest because of the elevated tax rates on capital gains and dividends.
I didn’t refuse, nor did others. I have worked with investors for 60 years and I have yet to see anyone — not even when capital gains rates were 39.9 percent in 1976-77 — shy away from a sensible investment because of the tax rate on the potential gain. People invest to make money, and potential taxes have never scared them off. And to those who argue that higher rates hurt job creation, I would note that a net of nearly 40 million jobs were added between 1980 and 2000. You know what’s happened since then: lower tax rates and far lower job creation.
And it's gotten worse over time.
Since 1992, the I.R.S. has compiled data from the returns of the 400 Americans reporting the largest income. In 1992, the top 400 had aggregate taxable income of $16.9 billion and paid federal taxes of 29.2 percent on that sum. In 2008, the aggregate income of the highest 400 had soared to $90.9 billion — a staggering $227.4 million on average — but the rate paid had fallen to 21.5 percent.
Buffett's solution is to tax those earning over $1,000,000 a year at a higher rate.
Job one for the 12 is to pare down some future promises that even a rich America can’t fulfill. Big money must be saved here. The 12 should then turn to the issue of revenues. I would leave rates for 99.7 percent of taxpayers unchanged and continue the current 2-percentage-point reduction in the employee contribution to the payroll tax. This cut helps the poor and the middle class, who need every break they can get.
But for those making more than $1 million — there were 236,883 such households in 2009 — I would raise rates immediately on taxable income in excess of $1 million, including, of course, dividends and capital gains. And for those who make $10 million or more — there were 8,274 in 2009 — I would suggest an additional increase in rate.
My friends and I have been coddled long enough by a billionaire-friendly Congress. It’s time for our government to get serious about shared sacrifice.
The problems with taxation go much deeper than this, but Buffett's plan would make a good start.

Wednesday, August 17, 2011

Sub-Standard and Poor in Cartoons

The reputation of Standard and Poor took a big hit when they rated toxic mortgage securities as AAA grade. They've now downgraded US debt from AAA to AA+, but US debt remains in significant demand despite the political crisis in the US.

These cartoons tell the story fairly neatly ...  and a Peanuts for good measure