There are a series of big debates going on in Australia's economic policy bureaucracy about the economy, house prices and the resources boom. Generally the Reserve Bank of Australia has been much more optimistic than Treasury, whose recent
Red Book briefing to the incoming government highlighted a series of Australian economic vulnerabilities. A key optimist in the debate about the economy is the RBA's Deputy Governor, Ric Battellino. The RBA provides a wealth of information on the Australian economy and a fantastic amount of economic data. (see, for example, the
Monthly Chart Pack)
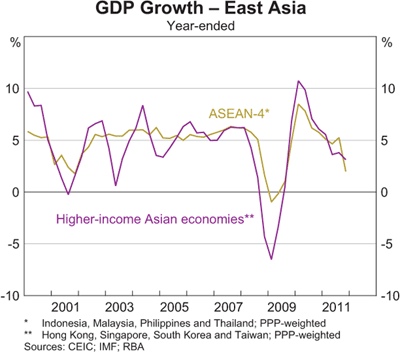
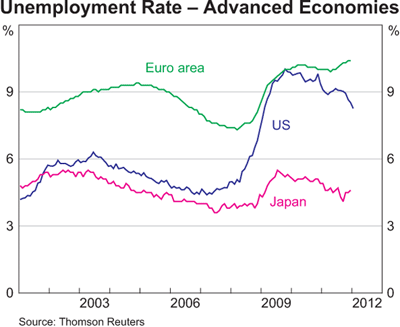
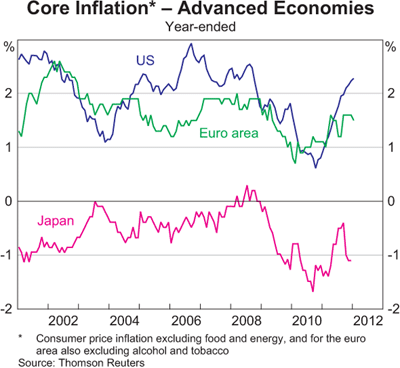
In a recent address Battellino begins by pointing out how divided the world economy is at present.
He then goes on to show the appalling state of the US housing market with foreclosures accounting for almost 1 in 20 mortgages.
Household net wealth in the US as a percentage of disposable income has fallen enormously and is back at the levels of the late 1980s. This highlights why financially-induced recessions are often so long lasting and recoveries so weak as households deal with the fact that they aren't as rich as they were even quite recently!
As Battellino points out:
the reaction of households to all this has been to stop borrowing, cut back on spending and increase savings, all of which means that US households are not going to be the driving force of the global economy that they were for much of the period since the mid 1990s.
Highlighting why so many in the US are so angry but without mentioning it, Battellino points out that "the US corporate sector, on the other hand, is in pretty good shape".
Profits have recovered strongly and the arrears rate on loans to US corporates has peaked at a level that is quite moderate by historical standards; it is no higher than in the 2001 recession, which, as I have noted, was quite mild. ...
Also, holdings of cash by US corporations are at record levels – almost US$1½ trillion or equivalent to over 20 per cent of corporate debt. This means that US corporations are in a strong position to increase investment when confidence returns.
According to Battellino, the objective of the Federal Reserve's efforts to stimulate the economy through monetary policy (according to Bernanke) or quantitative easing (according to most others) is
to put downward pressure on market interest rates, so as to encourage households and businesses to borrow, and to provide banks with extra liquidity, so as to encourage them to lend. As noted, however, US households have little appetite for debt at present, US corporations are flush with cash and have little need to borrow, and banks appear to be quite happy to leave their extra liquidity on deposit at the Fed, rather than lend it. US banks are currently holding about 8 per cent of their assets on deposit with the Fed, while their loans to households and businesses are falling. (my italics)
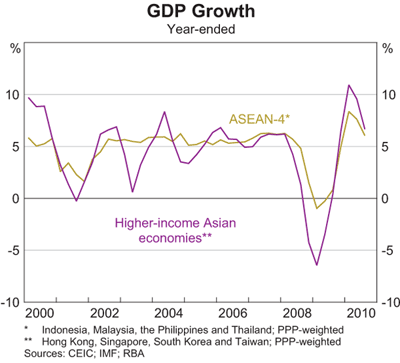
With Asia doing so much better than the US or Europe, inflation, especially in food prices, is causing wider concern amongst monetary authorities. Never one to argue that house price rises should be seen as a problem, Battellino argues that they simply reflect "the favourable economic and financial climate" of many countries in Asia. Battellino is a true bull about the sustainability of house pricces and household debt.
One of the major factors behind Australia's excellent economic performance has been rising commodity prices. As the figure below shows after a significant fall during the global recession, iron ore prices have returned to pre-crisis highs, while coking coal prices have also recovered.
Battellino reports that:
As a consequence, Australia's terms of trade – the ratio of export prices to import prices – have surpassed the 2008 peak, and are pretty much at unparalleled levels. The increase in the terms of trade over the past year has added around $25 billion to the Australian economy.
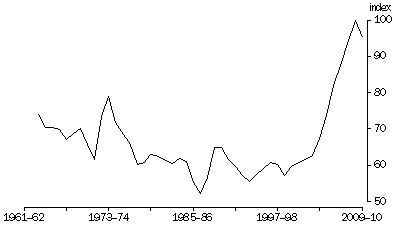
But as he notes, the real issue for Australia is the question of the sustainability of this elevated terms of trade. Historically the terms of trade (see below) has fallen rapidly after booms and it was the continuous decline in the terms of trade from the 1970s to the mid-1980s that made many policy-makers worried that Australia had a third world economy (culminating in Keating's banana republic warning). It was also a major factor in pushing policy-makers to restructure the Australian economy.
 |
| Terms of Trade 1901-2009 |
Source: Treasury
The most recent figures for the terms of trade show just how well Australia has been doing. According to the
ABS:
The strong growth in terms of trade over the past ten years reflected over 38.2% growth in Export prices and a fall in Import prices of 12.6% ... In 2009-10, the Terms of trade decreased by 4.8%.
 |
| Terms of Trade ABS 5204.0 |
But the stats from
5206.0 show that the decline was all in the first part for the year.
 |
| Terms of Trade ABS 5206.0 |
Battellino argues that the RBA has long forecast a gradual decline in the level of the terms of trade and that this remains the consensus, but he also notes that "recent commodity price outcomes have caused us to revise up our forecasts".
Beyond the next couple of years, it is hard to predict what will happen. Both China and India, however, are going through a phase of their development that is very intensive in the use of steel. In the past, other countries have taken up to 20 years to move through this phase. It is likely that China, and more particularly India, will have strong demand for steel for quite some time yet. This, of course, would be a very favourable global environment for the Australian economy.
The India one is most interesting suggesting that if India can continue its development process (with associated urbanisation) then demand for Australian coal and iron ore will continue for sometime (even if its at reduced prices because of increasing supply).
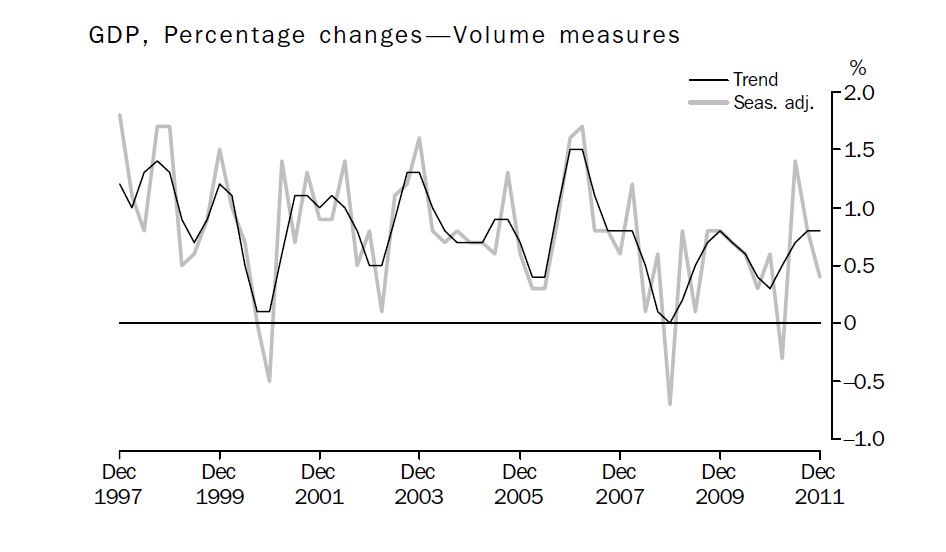
Battellino then turns to the Australian economy and notes that the downturn in Australia was relatively shallow. The year ended growth figures don't go into the negative reflecting the fact that Australia had just one quarter of negative growth (i.e. not a recession) as it did in 2000.
There is, however, a question mark over the Australian consumer.
Consumer spending has grown by a little below trend over the past year. It seems that even though consumer confidence is high, consumers remain cautious in their spending. The household saving ratio has picked up noticeably from the low levels it fell to earlier this decade. As we have said before, a period of consolidation by Australian households, after 10–15 years of fairly robust increases in spending and gearing, is probably no bad thing.
Battellino is a housing market bull based on the under supply theory.
Investment in new dwellings has increased over the past year, though growth in the number of dwellings is still falling short of growth of the population. As a result, rental markets are tightening, with vacancy rates falling and rents rising at a solid pace. At the same time, however, households now seem to be less inclined to increase their gearing in order to trade up to better housing. Auction clearance rates have fallen back to around long-run average levels and house prices have been relatively flat over recent months. This is in keeping with the more financially conservative approach that Australian households have taken recently. These trends are probably most pronounced here in Perth, which is going through a period of adjustment after the euphoria of 2006 and 2007.
Anyone wanting a counter-argument to this should read
Leith van Onselen's excellent case for an Australian housing market bubble.
Business investment has been strong, particularly in the mining sector.
According to Battellino "information published by the Australian Bureau of Statistics, as well as our own liaison with companies, suggest that it will pick up sharply further over the next couple of years". This will help to sustain Australian growth if it eventuates.
The major weakness in investment is in non-residential building:
Following large increases in gearing and commercial property prices in 2006 and 2007, the commercial property market has since deleveraged and prices have fallen. The bulk of that adjustment is probably now over, though the availability of finance for commercial property development remains very tight.
While lending to households remains moderate, business credit remains weak. This is mainly for big business as lending to unincorporated business has continued to grow.
We have spent a fair amount of time at the Bank looking at the question of why business credit is so soft. It is clear that banks had tightened lending standards sharply following the onset of the global financial crisis, which no doubt contributed to the slowdown in business lending. This has been most acute in the area of commercial property, where there has been a sharp cutting back, particularly by foreign-owned banks.
More recently, there are signs that banks are becoming more willing to lend, at least in areas other than commercial property, but demand for loans, in aggregate, is not very strong. It seems that the investment that is taking place in Australia, particularly in the case of the mining sector, is largely being financed outside the banking sector, either from retained earnings, direct investment from overseas or capital market raisings. (my italics)
Another issue constantly in the news at the moment is the level of the Aussie dollar. A much better indicator of the strength of the Aussie and that is more relevant to Australia's international trade is the
Trade Weighted Index. A higher value for the dollar negatively impacts Australian exports as they become more expensive in overseas markets and also affects import-competing buinesses as imports become cheaper. It also negatively impacts Australian overseas profits that need to be repatriated. (Just ask any Australian with money in English or American banks whether they want to bring their money home at the moment!)
On a 'real' basis (that is allowing for inflation) the effective "exchange rate remains below the levels recorded in the resources boom of the early 1970s", when Australia did not have a freely floating currency (instead the RBA set the value).
According to Battellino there are positives and negatives to a high exchange rate.
A rise in the exchange rate is a natural consequence of a resources boom and, at the aggregate level, is helpful in allowing the economy to adjust. Nonetheless, some sectors of the economy are adversely affected. A notable example at present is the tourism industry, where there has been a sharp increase in the number of Australians travelling abroad rather than taking holidays domestically. This is having a severe effect on traditional holiday destinations in Queensland, areas which are also suffering from overbuilding in the pre-crisis years. Given this double impact, it is not surprising that these areas are currently experiencing among the highest rates of unemployment in the country. The Bank is monitoring developments in these areas closely.
Overall Battellino argues that the economy is travelling well:
While there are differences between sectors and between regions, the Australian economy overall is doing well. We expect that the economy will continue to grow at a solid pace over the next couple of years, with growth picking up to an above-trend rate towards the end of this period. This will be accompanied by further increases in jobs and falls in unemployment.
With the economy now having grown more or less without interruption for about 20 years, it is understandable that spare capacity is limited. This means that the economy cannot grow much above its potential rate without causing a rise in inflation. With a large amount of money continuing to flow into the country over the next couple of years as a result of the resources boom, the challenge will be to manage the economy in a way that keeps economic growth on a sustainable path, with inflation contained. This is what the Bank is trying to do.
At present, inflation is broadly in the middle of the target range. Over the medium term, though, as growth of the economy picks up, the pressures on inflation are more likely to be upward than downward. This is reflected in the forecasts the Bank recently published, which see inflation tending to rise after a period of near-term stability.