Showing posts with label finance. Show all posts

Tuesday, April 2, 2013

Financialisation and Globalisation: Permament Reverse or Cyclical Downturn?

Introduction


One of the major markers of globalisation since the 1970s has been the incredible expansion of the financial sector - a phenomenon known as financialisation. The financial sector expanded in virtually every country in the world. Since this time the process of financialisation (defined as the expansion of both domestic and global finance) has been been in retreat as has financial globalisation (defined by cross-border financial flows only).

The global crisis, not surprisingly, has been primarily responsible and it will take quite some time for capital flows to recover, especially if the European financial crisis deepens. The expansion of credit/debt has stalled and the excesses of pre-crisis finance continue to be worked out of the system, Over the medium-term, even in the absence of another systemic financial crisis, it is likely that financialisation will be restricted by global deleveraging as excessive indebtedness is worked out of the world economy.

Nevertheless, wariness about financial instability will continue to be challenged by financial innovation and the possibilities for profits in new financial products. Despite arguments that the global financial crisis showed the need for better regulation of financial markets, it is not clear that this view has overcome the arguments of financial interests for few substantial changes to regulation. Financialisation continues to progress in developing countries and financial globalisation will recover as the world economy recovers.

The issue for the future is whether a financialised world political economy is inherently prone to a cycle of crisis, retreat, recovery, stability, excesses, crisis. While it is possible to argue that financialisation has reached a high point in many developed economies, it is likely that developing countries will become even more important global financial players in coming years - both as recipients and investors.

In Australia, the financial sector has grown rapidly since financial liberalisation in the 1980s. The cyclical downturn in the financial sector has not been as extreme and Australian banks are in rude health compared to banks in other developed economies. The solid performance of the Australian financial system has been helped by the government's willingness to support the financial system during the crisis and the avoidance of recession. The household sector remains highly indebted and foreign debt remains at highest ever levels. Any renewed expansion of credit will increase Australia's medium-term financial vulnerability.  Policy-makers should be aiming to foster a period of consolidation in the Australian financial markets and the property sector.


Financialisation and Financial Globalisation

According to McKinsey, global financial assets increased from about US$12 trillion in 1980 to US$206 trillion in 2007. Financial depth (defined as financial assets as a percentage of GDP) increased from 120 per cent to 355 per cent over the same period. By 2012, financial assets had increased to $225 trillion, but compared to world GDP they had declined by 43 per cent (54 per cent if government debt is excluded). Declines have occurred in both developed and developing countries. Developing countries are significantly less financialised than developed countries with financial depth of 157 per cent compared to 408 per cent. China's financial depth (226 per cent) is considerably lower than that of the United States (463 per cent - down 37 per cent from 2007 up to mid 2012), Japan (453 per cent) and Western Europe (369 per cent) , with India (148 per cent) lower still.


Finance progressively detached itself from the 'real' economy with just over a quarter of the rise in financial depth between 1995 and 2007 related to households and non-financial corporations. This is astounding given the extensive growth of mortgage markets in virtually all developed economies.

These figure above relate to the growth of finance generally, but if we consider cross-border movements of capital (an integral component of globalisation alongside trade) it is clear that the process has gone backwards since the crisis, declining substantially since 2007 from $11.8 trillion to around $4.6 trillion in 2012.

Most of the fall (70 percent) is accounted for by Western Europe - a substantial reversal of financial integration as European banks have retreated from cross-border lending. Central banks have become more important in cross border flows in Europe, accounting for over 50 percent of capital flows. Cross-border flows have fallen from 20 per cent of global GDP in 2007 to 6 per cent in 2012, a remarkable decline.

Capital flows involving developing countries have rallied since the debacle of 2008-09. Developing countries have increased their share of cross-border flows from 5 per cent in 2000 to 32 per cent in 2012. More capital flowed out of developing countries than flowed in - US$1.8 trillion compared to US$1.5 trillion.


Financial globalisation (i.e. cross-border financialisation) is still extensive with around 30 per cent of global equities and bonds owned by foreigners (54 percent for Europe, 23 per cent for North America and 9.4 per cent for China).


Australia

Australia, of course, has been a willing participant in the process of financialisation. A recent speech by Malcolm Edey, Assistant Governor (Financial System) at the Reserve Bank of Australia, reveals the extent of the financialisation of the Australian economy up to 2007 and its retreat after the crisis.

Edey points out that credit to GDP "increased from around 50 per cent in the mid 1980s to around 160 per cent in 2007". Total banking system assets "rose from around 50 to around 200 per cent of GDP" and "foreign exchange turnover increased by a factor of more than 30 in nominal dollar terms over that quarter-century, when the nominal economy itself expanded only by a factor of 4½.

The process of financial liberalisation began in Australia in the late 1970s and accelerated through the mid-1980s. Although many people seem to have forgotten Australia had a serious financial crisis in the late 1980s to early 1990s, which ironically may have helped us in the global financial crisis as banks remained more cautious through the 1990s and early 2000s.

The graph below shows just how much Australian financial sector assets have increased over the past 25 years.


The Australian banking sector avoided the excesses of some banking systems such as Ireland, Iceland, the United Kingdom and France among others. US problems lay outside of an extensive build up in banking assets.


The wealth management sector has also expanded since the 1980s, although much of that has to do with a new 'regulation' of enforcing superannuation payments for all Australians in work - hardly de-regulation. As Edey points out: 
Funds under management (principally in superannuation and life offices) expanded from around 30 to around 130 per cent of GDP between 1985 and 2007, broadly matching the growth rate seen in the deposit and loan sector. And, of course, there has been a huge growth in services related to asset and risk management, including securities and derivatives trading.
Both managed funds and securitisation took a big hit from the financial crisis, but all sectors have been affected, reversing the process of financialisation. Continuing woes in Europe are likely to see many investors less amenable to risk. Although this can change rapidly as investors often seem to have short memories. The recent rise of the share market would be worrying many of those who sold out of equities and encouraging many to get back in, which will further inflate the share market, possibly setting it up for a large correction down the line.

Another impact of liberalisation has been the decline in interest rate margins. This is despite the fact that the Australian banking sector is dominated by the big 4 banks. While it is easy to point to the costs of liberalisation in terms of the tendency towards crisis, it is important to remember that easier access to credit has benefits as well.


As Edey points out the post-liberalisation financial system
changed profoundly in other ways than just size. One was in its degree of openness to competition and in the nature of that competition. The post-Campbell reforms allowed market forces to work, and opened up the system to new competitors. ...  Deregulation ended the artificial rationing of bank loans, making credit much more widely available ... the cost of financial intermediation came down very substantially. ...
The rationing that existed in the old regulated environment had encouraged banks to compete on a ‘whole of institution’ basis, rather than at the level of individual product lines. ... In this situation, wide interest margins were used to cross-subsidise payment services, and customer mobility was limited because loyalty to a bank was one of the critical factors in obtaining access to scarce loans.   
Deregulation changed that model by allowing innovators to compete separately for the most profitable lines of business. Cross-subsidies in the banking system were competed down, and this helped to drive the reduction in net interest margins.
If given a choice between going back to the old system of regulated banks and credit or staying with the current system with all its problems, most would choose the latter, especially if it were explained that it would mean less access to credit. But this is obviously part of the problem too, greater willingness to extend credit during periods of asset price ebullience can lead to deteriorating lending standards increasing the possibilities of non-performing loans down the line. Thus far this has not occurred in Australia, with the excellent growth performance of the Australian economy providing a sound macroeconomic environment (low unemployment) and a cautious household sector increasing saving.


Banks have also remained extremely profitable, which has been reflected in their share prices.


Still household indebtedness remains close to pre-crisis highs, which makes households and the wider economy vulnerable to changing macroeconomic conditions and a decline in international financial supply. Housing-related debt accounts for 81.6 per cent of household interest payments to income and 90 per cent of debt to income. Interest payments as a percentage of disposable income have come down from their pre-crisis peak, but are still higher than they were in the late 1980s when mortgage rates reached 17 per cent! (see Table B21)


Competition in the banking sector until recently was mainly on the lending side of the equation, but as banks have sought alternative sources of funding, competition for deposits has increased. Banks have reduced their reliance on short-term debt and securitisation has also declined from a lower base.


The wholesale funding mix for banks has also shifted away slightly from overseas sources, but clearly the major change is away from short-term funding.


The high level of debt build-up from the 1990s to 2007 has stabilised in the post-crisis years. Australians have returned to saving. The share market has recovered and property continues to tread water.


Not surprisingly, credit growth in all sectors has been flat in recent years.


A renewed property boom runs the risk of reversing this trend, leading to a bigger adjustment down the track. Having built up their debt share so high households can only increase their leverage at the cost of higher vulnerability. This is one of the reasons the RBA needs to take care when regulating new lending products and lowering interest rates further, without compensating policies from the government to discourage housing speculation.


Australian households are now more connected to the financial sector, through higher levels of debt and forced saving through Australia's superannuation system.  The Australian economy is also more connected to the global financial system. Banks and other corporates have increasingly turned to offshore sources for funding.


Currently, according to the RBA's Deputy Governor Guy Debelle, "domestic markets have benefited from strong international demand for Australian dollar assets. Local issuers continue to be viewed favourably by offshore investors looking to diversify credit exposures."

Extensive foreign liabilities mean that Australia will continue to remain vulnerable to changes in international financial sentiment, although it needs to be noted that Australia has recently passed a very severe test during the GFC. Many other countries have not been so lucky with stagnant growth and continuing financial trials.

Financialisation affects us all and it is policy that must determine the balance between the individual benefits of increased access to credit and the possibilities of financial instability. Australia's financial sector remains sound but an eventual recession will test the financial sector and its growth in Australia, especially if lending standards deteriorate over the next few years.

Conclusion

Financial globalisation has ebbed and flowed over the past couple of hundred years. The period before World War One is often called the golden age of capitalism but it ended in war and economic depression. It took a long time for financial flows to recover, but recover they did.
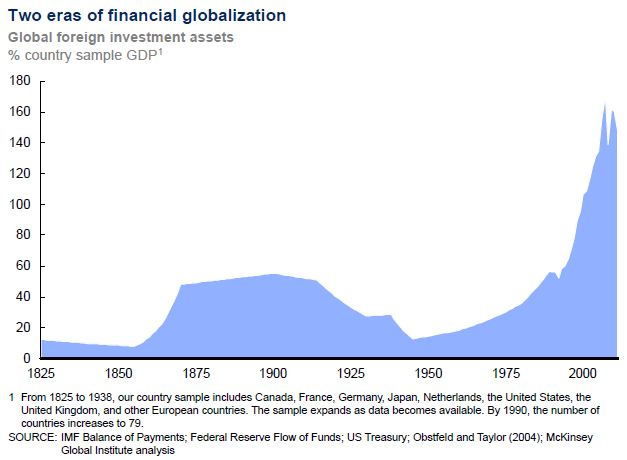


Despite some setbacks in recent years, the world economy remains highly globalised and financialised. In considering whether the current period is a permanent reversal or just a pause in the two distinct but related processes, requires detailed analysis of political processes in the major economies of the world. It seems unlikely that United States policy-makers will change their mind on the benefits of financial liberalisation and financialisation, but a prolonged period of economic stagnation could have an impact on this predilection.

Virtually the entire world adheres to a form of capitalism and while not all policy-makers in all countries are equally sanguine about globalisation, very few currently believe that the solution to development requires a full scale retreat into isolation.

This could change, however, if globalisation is blamed for growing inequality and political chaos. It may be the turn of developed countries to support alternatives to globalisation if economic crisis continues to affect growth and the distribution of wealth and income across societies. Democratic polities cannot necessarily be blamed for looking to more insular alternatives if increasing globalisation is associated with rising inequality and instability.




Monday, March 11, 2013

Financialisation and Globalisation

Financialisation is a major component of recent globalisation but it also represents a key danger to the sustainability of global economic interconnection.

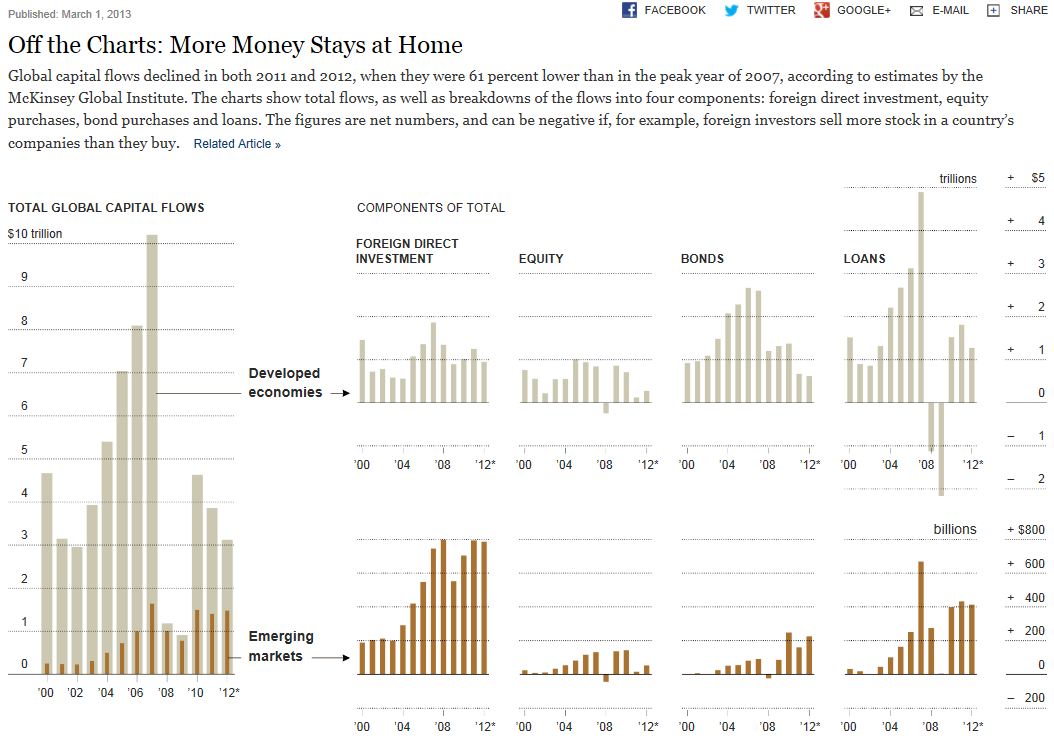
This recent graph from the NYT based on McKinsey research, shows how big a hit financial flows took from the financial crisis. It also shows just how rapidly financial flows increased in the lead-up.

Every element of financial flows - direct investment, equity, bonds and loans are well below their  peaks before the crisis - with loans taking the biggest hit. Emerging market economies have done relatively better, but investment was down last year.


Friday, March 9, 2012

Australia's Trade and Financial Performance

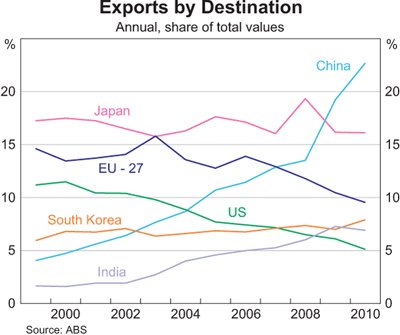
Australia's trade performance has been marked by a shift back towards resources since the early 2000s, with a remarkable shift in trade towards China over the past 10 years from under 5% to about 27% today.

This bonanza is reflected in Australia's terms of trade. 


The terms of trade is an index-measure ratio of the average price level of exports to the average price level of imports. It effectively reflects the capacity of a given quantity of exports to pay for a given quantity of imports, and provides an important indication of the strengths and weaknesses of the economic structure. A rising or falling terms of trade indicates the possibility of improving or declining living standards, because if what we sell earns relatively more than what we buy, we will be relatively wealthier. Because the terms of trade is a ratio, increases can be a result of export prices increasing at a greater rate than import prices, or export prices increasing while import prices are declining, or export prices declining at a slower rate than import prices. Of course, a rising terms of trade doesn’t stop us from buying more things than we sell, which we have made a habit of for much of our history! Improvements in the terms of trade are not reflected in GDP figures, but improvements do contribute significantly to increases in national disposable income.
 
Most commentators now think that the terms of trade has peaked and this appears more clearly in commodity prices. The terms of trade has provided a big income boost to Australia, which is not directly measured in GDP growth figures, but obviously higher income eventually has an impact on growth. Alongside the paying off of debt and the end to the effective increase in real income that comes from a higher exchange rate and lower import prices, these factors makes for a less favourable outlook for Australians over the coming year.


Note the rapid ascent of China as a share of the total and the less dramatic, but still significant growth of India's share. Compare this to the decline of the EU and US shares.


The increase in the volume of bulk commodity exports is a major factor, although the major influence on income has been the increase in prices rather than the increase in volumes.


One of the consequences of the resources boom has been an amazing growth in the level of mining investment. Given that Australia's mining sector is 80 per cent foreign owned (according to the RBA), much of this investment comes from overseas and much of the profit (eventually) also goes overseas. This negative impact on the current account deficit is offset by the positive impact of increased resource exports.

Remember that current account deficits (CADs) can be viewed in two ways (see here for explanation). While both are correct, how commentators measure them is sometimes indicative of ideological proclivities or agendas. For those worried that Australia doesn't generally export enough to cover its imports, the current account deficit is seen as the trade deficit plus the income deficit, which measures the balance of interest and dividend payments away from Australia. The mining sector is a case in point. Given that it is 80 per cent foreign owned a good deal of profits (dividends) flow out of the country. Also give that Australia has a huge foreign (private) debt, a lot of interest payments must be made to foreigners. In this interpretation of the CAD, the solution is to increase exports and cut foreign borrowing. The formula for this version is:  

CA = X - M + NY + NCT

X = Exports of goods and services
M = Imports of goods and services
NY = Net income abroad
NCT = Net current transfers

Remember that the current account can be a CAS i.e. a current account surplus. For the world as a whole deficits and surpluses must match unless we start trading with another planet. See here for further explanation.


The other way of viewing the CAD is to see it as the difference between saving and investment. This is the way most economists, especially Treasury and the RBA prefer to view the CAD because it is an accounting identity. Now obviously the two formulae can be reconciled, but I won't bore you with the details here. 

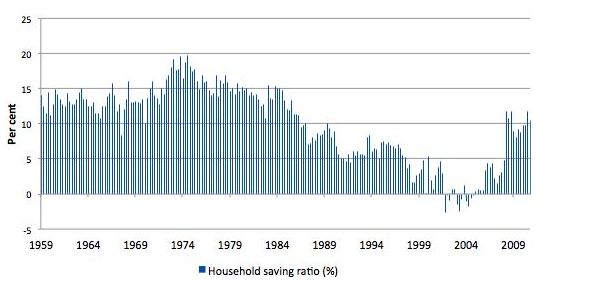
The CAD = Saving - investment approach is also preferred as an explanation because it correctly implies that Australia's CAD is driven by high investment in the mining sector, rather than low saving. Indeed Australian saving has returned to more normal levels since the GFC after a period of negative saving. 


This is from the latest ABS quarterly accounts. 


A longer term view is provided by Bill Mitchell, which shows that saving patterns are simply returning to earlier levels. 


Now if saving increases, this should mean that more Australian investment can be funded domestically, but we are currently going through the biggest mining investment boom in our history. (What is most interesting about this boom is that there is both a massive terms of trade boom and a massive investment boom at the same time). 


The following graph from RBA Deputy Governor Philip Lowe shows just how big is that investment surge.


As a consequence it is not surprising that Australia's foreign financial liabilities remain high.


Sunday, March 14, 2010

Measuring Economic Weight

The Economist recently ran a story on putting the rise of Asia in perspective it's worth a read and is a useful corrective to many of the arguments that think the future is already here! The Balance of Economic Power: East or Famine The Economist.

There are two main ways to measure the size of economies. We can convert the value of Chinese gross domestic product (GDP), for example, into US dollars and compare it to the GDP of other countries. The advantage of this method is that it provides a neat comparison of a particular country with any other country at any particular time. But the problem with this measure is that it varies with the dollar–renminbi exchange rate and doesn’t accurately reflect the cost of things within the Chinese economy. If the renminbi was revalued this would immediately increase the measured size of the Chinese economy. This is not completely spurious because a higher valued renminbi would enable the Chinese to buy more goods and services on the international market and would increase their ability to invest in other countries. When exchange rates do vary considerably over time, such as the dollar–yen exchange rate since the 1970s, this method may be a problem. For example compare the difference in size of the Australian economy when measured at a time when the Australian dollar was 47.75c against the US dollar in April 2001 to when it reached 98.49c against the US dollar in July 2008. Although for measuring purposes the exchange rate is averaged over a period, variation still poses obvious problems.
Such discrepancies have led to the increased use of an alternative method of measuring the size of economies based on the concept of purchasing power parity (PPP). Statisticians measure purchasing power within individual economies and then makes comparisons on that basis. PPP measures GDP adjusted to reflect different costs of living and production within different economies. Goods and services and production costs are considerably less in China than they are in the United States. We all know that our currency goes further in some countries and less in others. You can live, for example, much more cheaply in Indonesia than you can in Sweden! A popular representation of PPP values is the Economist magazine’s tongue-in-cheek Big Mac Index, which compares the price of Big Mac’s around the world. A Big Mac in Sweden ($4.58) will cost you a lot more than a Big Mac in Indonesia ($1.74) or even the United States itself ($3.45). According to PPP theory, the cost of Big Macs should be the same across countries once local currencies are converted to US dollars. In these February 2009 prices, the Index suggests that the Swedish Kroner is overvalued against the dollar and the Indonesian rupiah is substantially undervalued. Big Macs are not really a good marker of PPP because they are generally considerably more expensive than local-food items in developing countries! There is also now an iPOD Index, which does the same thing, but with a high technology, tradeable item rather than a basic food item. This is significant because products that can be easily traded should, through the process of arbitrage, end up with the same price (allowing for exchange rates).

If we compare what a given amount of dollars will buy in the Chinese economy and compare it to what a given amount of dollars buys in the US economy we can, according to advocates of this approach, get a better idea of the size of an economy. The problem with this method is calculating the different costs of production and living on an ongoing basis. To do a proper analysis of PPP, the World Bank compares a large range of goods and services. It is very difficult to get a comparable basket of goods for diverse countries with substantially different cultures and consumption norms. In December 2007, the International Comparison Program co-ordinated by the World Bank revised down its PPP estimate of China’s economy by 40 per cent making a considerable difference to the measured size of the Chinese economy in 2005!

The best solution to the problem is the messy one of considering both measures together. Table 3.1 below shows that the United States accounted for 21.1 per cent of global GDP on a purchasing-power-parity basis in 2007, down from 23 per cent in 1995 and 24.5 per cent in 1980. China has rapidly caught up, accounting for 10.1 per cent in 2007 (revised down by the Bank by 6 per cent from earlier 2007 estimates!), up from 5.7 per cent in 1995 and 2.2 per cent in 1980. Measuring shares of global GDP by converting a country’s GDP to US dollars at market exchange rates produces very different results. On this basis, as Table 3.2 shows, in 2007 the United States was more than four times larger than China, accounting for nearly 25.3 per cent of global GDP, compared to 6.0 per cent for China. In 1995, according to this measure, the United States was 10 times larger than China. On an exchange basis, Japan’s relative position increased significantly between 1980 and 1995, with the increased value of the yen in the mid-1990s improving Japan’s position. On an exchange basis, Japan’s share of the world economy declined by half between 1995 and 2007. On a PPP basis, Japan’s economy has declined by a much smaller amount. These tables show that US decline has been gradual and that China’s rise has been mainly at the expense of Japan.
In 2006, the developing world accounted for more than 50 per cent of global GDP (measured on a PPP basis), signalling its growing importance. Developing countries grew at a faster rate between 1995 and 2005 than they did during the previous two decades and considerably faster than developed countries. In 2006, developing countries accounted for 43 per cent of world exports, up from 20 per cent in 1970; half of the energy consumption; and 70 per cent of currency reserves. Many see India as a major challenger to China’s mantle as the most important developing country. While China causes considerable anxiety in the developed world about its growing domination of manufacturing, India creates concerns because of its competitiveness in higher paid service and technology jobs. Outsourcing to India will increase in coming years and become even more important as a topic of debate.

But as The Economist reports:
Since 1995 Asia’s real GDP (even including less sprightly Japan) has grown more than twice as fast as that of America or western Europe. Morgan Stanley forecasts that it will grow by an average of 7% this year and next, compared with 3% for America and 1.2% for western Europe.
Yet a closer look at the figures suggests that the shift in economic power from West to East can be exaggerated. Thanks partly to falling currencies, Asia’s total share of world GDP (in nominal terms at market exchange rates) has actually slipped, from 29% in 1995 to 27% last year (see chart 1). In 2009 Asia’s total GDP exceeded America’s but was still slightly smaller than western Europe’s (although it could overtake the latter this year). To put it another way, the output of the rich West is still almost twice as big as that of the East.


As the graphic makes clear, Asia's (especially) China's growth is considerably more significant when it comes to measurements based on PPP. China's currency is kept artificially low and if allowed to rise China would increase its economic weight, but at the same time it would slightly undermine China's export growth potential as Chinese exports became relatively dearer on global markets.

So what about Asian exports? The Economist reports
the region’s 31% share of world exports last year was not much higher than in 1995 (28%) and remains smaller than western Europe’s. Indeed, the shift towards Asia appears to have slowed, not quickened. Its share of world output and exports surged during the 1980s and early 1990s. Although China’s share has grown since then, this has been largely offset by the decline in Japan, whose share of output and exports has halved.
A renewed emphasis on exports by the US could be an outcome of the economic crisis and the Obama administration aspires to doubling US exports in 5 years. (See "Can Obama Really Double Exports in Five Years?".) This doubling figure of course also requires some unpacking. It would be more meaningful if it meant a doubling of exports in comparison to the rise of GDP rather than a simple doubling of the USD figure.

What about the financial sphere?
Asian stockmarkets account for 34% of global market capitalisation, ahead of both America (33%) and Europe (27%). Asian central banks also hold two-thirds of all foreign-exchange reserves. That sounds impressive, but their influence over global financial markets is more modest, because official reserves account for only around 5% of the world’s total stash of financial assets. The bulk of private-sector wealth still lies in the West. The fact that Asian currencies make up only 3% of total foreign-exchange reserves indicates how far Asia still lags in financial matters.
While there is no doubt that on a PPP basis Asia has been expanding enormously, it's important to remember that Asia's international transactions are mainly conducted in USD. Asia (once again especially China) consumes considerably less than Western countries.
What really matters to Western firms is consumer spending in plain dollar terms. Although over three-fifths of the world’s population live in Asia, they only account for just over one-fifth of global private consumption, much less than America’s 30% share. But official figures almost certainly understate consumer spending in emerging Asia, because of the poor statistical coverage of spending on services. Figures from the Economist Intelligence Unit, a sister company of The Economist, suggest that Asia accounts for around one-third of world retail sales. Asia is now the biggest market for many products, accounting for 35% of all car sales last year and 43% of mobile phones. Asia guzzles 35% of the world’s energy, up from 26% in 1995. It has accounted for two-thirds of the increase in world energy demand since 2000.
Many Western firms are more interested in Asia’s capital spending than its consumption, and here Asia is undoubtedly the giant. In 2009, 40% of global investment (at market exchange rates) took place in Asia, as much as in America and Europe combined. In finance, Asian firms launched eight of the ten biggest initial public offerings (IPOs) in 2009 and more than twice as much capital was raised through IPOs in China and Hong Kong last year as in America.
Finally, The Economist, contains a graphic illustrating just how far Asia fell from its historical position of dominance up until 1800.


This graph, however, provides a lesson that The Economist, perhaps did not intend. Despite its continuing dominance of the world economy until the early nineteenth century, from the mid sixteenth century Europe - led by Spain and Portugal, followed by Holland and England - is clearly in the ascendancy. Gross economic weight is clearly not everything.

Wednesday, December 16, 2009

De-globalisation

McKinsey generally have the best coverage of global capital flows and their latest report shows just how significant the global financial crisis has been for financial globalisation.

In its latest report Global capital markets: Entering a new era McKinsey reports that:
World financial assets fell $16 trillion to $178 trillion in 2008, marking the largest setback on record and a break in the three-decade-long expansion of global capital markets. Looking ahead, mature financial markets may be headed for slower growth, while emerging markets will likely account for an increasing share of global asset growth.

Financial globalization reversed in the wake of the crisis. Capital flows fell 82 percent in 2008, to just $1.9 trillion from $10.5 trillion in 2007.

Declines in equity and real estate values wiped out $28.8 trillion of global wealth in 2008 and the first half of 2009.
Other pertinent points made:
Falling equities accounted for virtually all of the drop in global financial assets. The world's equities lost almost half their value in 2008, declining by $28 trillion. Markets have regained some ground in recent months, replacing $4.6 trillion in value between December 2008 and the end of July 2009. Global residential real estate values fell by $3.4 trillion in 2008 and nearly $2 trillion more in the first quarter of 2009. Combining these figures, we see that declines in equity and real estate wiped out $28.8 trillion of global wealth in 2008 and the first half of 2009.


Credit bubbles grew both in the United States and Europe before the crisis. Contrary to popular perceptions, credit in Europe grew larger as a percent of GDP than in the United States. Total US credit outstanding rose from 221 percent of GDP in 2000 to 291 percent in 2008, reaching $42 trillion. Eurozone indebtedness rose higher, to 304 percent of GDP by the end of 2008, while UK borrowing climbed even higher, to 320 percent.

Financial globalization has reversed, with cross-border capital flows falling by more than 80 percent. It is unclear how quickly capital flows will revive or whether financial markets will become less globally integrated.

Some global imbalances may be receding. The U.S. current account deficit—and the surpluses in China, Germany, and Japan that helped fund it—has narrowed. However, this may be a temporary effect of the crisis rather than a long-term structural shift.

Mature financial markets may be headed for slower growth in the years to come. Private debt and equity are likely to grow more slowly as households and businesses reduce their debt burdens and as corporate earnings fall back to long-term trends. In contrast, large fiscal deficits will cause government debt to soar.

For emerging markets, the current crisis is likely to be no more than a temporary interruption in their financial market development, because the underlying sources of growth remain strong. For investors and financial intermediaries alike, emerging markets will become more important as their share of global capital markets continues to expand.

The major issue in the short-term will be how quickly capital flows recover. Another key issue is how slower growth in mature markets will affect emerging markets' financial systems.

The severity of the also highlights just how amazing it is that Australia managed to avoid a downturn in growth over the 2008-09 financial year. For Tony Abbot to argue that the Rudd govt has achieved little in its first couple of years and for some economists to argue that the fiscal stimulus has been profoundly negative defies any logic. Instead it appears to be simple oppositional politics for the former and blind anti-govt rhetoric for the latter.

If it sounds unlikely, it probably is.