Thursday, May 23, 2013

The US Economy: Profits Up, Taxes Down

This from The Economist fairly much speaks for itself ...


Too many companies are legally avoiding paying tax, with Apple and Google serious offenders. This is despite the US having one of the highest nominal rate of corporate taxation.


According to one analyst (using OECD data):
In 2011, national statutory corporate tax rates among the thirty-four members of the OECD will range from 8.5 percent in Switzerland to 35 percent in the United States. When sub-national taxes are added, the United States has the second-highest statutory combined corporate tax rate – 39.2 percent – after Japan’s rate of 39.5 percent.
Despite having the highest national statutory rate, the United States raises less revenue from its corporate tax than do the other members of the OECD on average. In fact, federal corporate income taxes raise little revenue compared with other federal taxes; roughly comprising 11.6% of total federal tax revenues.
Corporations, like individuals, can and do use tax breaks to lower their tax burdens and, as a result, the effective tax rate is lower than the top rate.
Despite this she then goes on to argue that because of world-wide taxation of US companies, US corporate taxes are punishing. Astonishing that analysts can seemingly maintain their opinions in the face of facts! 

As Stephen Rattner argues:
As muddled and broken as the individual income tax system may be, the rules under which the government collects corporate levies are far more loophole-ridden and counterproductive.

That’s not entirely Washington’s fault. Unlike individuals, multinational corporations can shuttle profits — and sometimes even their headquarters — around the globe in search of the jurisdiction willing to cut them the best deal on taxes (and often other economic incentives).

Much of this occurs under the guise of “transfer pricing,” the terms under which one subsidiary of a multinational sells products to another subsidiary. The goal is to generate as high a share of profit as possible in the lowest-taxed jurisdictions.

A study by the Congressional Research Service found that subsidiaries of United States corporations operating in the top five tax havens (the Netherlands, Ireland, Bermuda, Switzerland and Luxembourg) generated 43 percent of their foreign profits in those countries in 2008, but had only 4 percent of their foreign employees and 7 percent of their foreign investment located there.

As a consequence, the effective corporate tax rate in the United States fell to 17.8 percent in 2012 from 42.5 percent in 1960, according to the Federal Reserve Bank of St. Louis. ...

Happily, the gaming of the tax system is becoming a global concern, with an action plan coming from the Organization for Economic Cooperation and Development in July. The O.E.C.D. should work toward taxing business profits where they actually occur, not where they’ve been shifted by some tax adviser.

Friday, May 17, 2013

Climate Change Scientific Consensus at 97%

This from The Guardian.
A survey of thousands of peer-reviewed papers in scientific journals has found 97.1% agreed that climate change is caused by human activity.

Authors of the survey, published on Thursday in the journal Environmental Research Letters, said the finding of near unanimity provided a powerful rebuttal to climate contrarians who insist the science of climate change remains unsettled.

The survey considered the work of some 29,000 scientists published in 11,994 academic papers. Of the 4,000-plus papers that took a position on the causes of climate change only 0.7% or 83 of those thousands of academic articles, disputed the scientific consensus that climate change is the result of human activity, with the view of the remaining 2.2% unclear. 
I'd bet on that assessment against the deniers of climate change, but I'd also bet that it will have little impact on those keen to see no actions taken to do something effective about climate change.

The solution seems clear to me - straight out taxes, not trading schemes where prices can plunge to the level of ineffectiveness. But the political will for the solution seems to have completely disappeared.

In my classes at uni, concern for climate change seems to have almost completely disappeared compared to student attitudes of even 2 years ago. Even more so if compared to the students of 5 years ago.

It seems that Tony Abbott once agreed:
I also think that if you want to put a price on carbon, why not just do it with a simple tax? Why not ask motorists to pay more, why not ask electricity consumers to pay more and then at the end of the year you can take your invoices to the tax office and get a rebate of the carbon tax you've paid.” Tony Abbott July 29th 2009 Interview with Sky News Australia ... 
Although there are these as well:
The climate change argument is absolute crap, however the politics are tough for us because 80 per cent of people believe climate change is a real and present danger.” Tony Abbott February 2nd 2010 7.30 Report, Australian Broadcasting Corporation  
There is much to be said for an emissions trading scheme. It was, after all, the mechanism for emission reduction ultimately chosen by the Howard government Tony Abbott July 27th 2009 tonyabbott.com.au 


Tuesday, May 14, 2013

The US-China Economic Relationship in Pictures

This from the US-China Business Council ... Well worth a read to break down a few myths about US-China relations.

Firstly, US exports to China have grown  at a far greater rate than US exports to the rest of the world.


 The next biggest growth market is Brazil, which has grown at 180% compared to 542%.


Not surprisingly Canada is a far more important export market for the US, followed by Mexico. See geography does still matter, despite the guff written about the "end of geography" in the 1980s. 


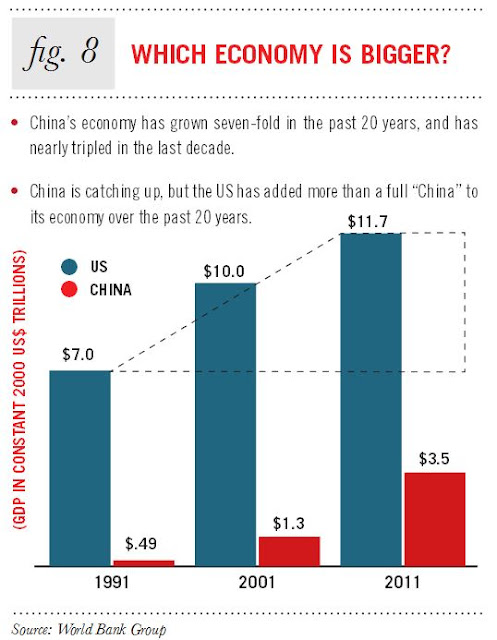
To prove its point about the continuing domination of the US economy, the authors use the USD exchange rate measure of economic weight. As I argue in How Big, How Rich and How Developed? The State of Play in the World Economy:
How we measure economies matters. To get a clearer picture of the world economy we need to look not only at size, but wealth, development and distribution. But even when measuring the size and wealth of economies, the method of measurement we choose will have a big impact on the outcome. ...
There are two ways to measure the size of economies. Firstly, we can convert the value of a country's gross domestic product (GDP) into US dollars and compare it to the GDP of other countries whose currencies have been converted into US Dollars also.  ... When exchange rates do vary considerably over time, such as the dollar–yen exchange rate after the 1970s, this method may cause distorted measures of size. ...
Such discrepancies have led to the increased use of an alternative method of measuring the size of economies based on the concept of purchasing power parity (PPP). Statisticians measure purchasing power within individual economies and then make comparisons on that basis. PPP measures GDP adjusted to reflect different costs of living and production within different economies. As most travellers know, goods and services and production costs are considerably lower in some countries than they are in others.


One should be very cautious about this projection, which seems to animate Australian policy-makers as well. It could turn out to be true, but before 2020 China is likely to suffer a big slowdown in growth, which might make these "middle class" growth projections come unstuck.


This is the one that would surprise most people. Although value-added measured via purchasing power parity would show a significantly different result I would think. Other analysts argue that the Chinese manufacturing sector surpassed the US manufacturing sector in terms of value-added late last decade. Remember too that value-added is just one way to measure the size of the sector (although it is perhaps the most important measure). China does a good deal of assembling still, but as wages increase these assembling operations will increasingly shift to elsewhere in Asia and perhaps Latin America.


Given the still very large US manufacturing sector it is not surprising that US companies' manufacturing assets are located mainly in the US itself.


Chinese foreign direct investment (non-bond investment) in the US has grown rapidly in recent years, but to put the level of Chinese FDI in the US into context, it is roughly the same as Chinese FDI in Australia.

As The Heritage Foundation reports: "The leading recipients of Chinese non-bond investment since 2005 have been Australia and the U.S. Other major recipients are Canada, Brazil, Britain, and Indonesia. In 2012 alone, Canada topped the list, thanks to the Chinese CNOOC's $15.1 billion acquisition of Nexen, the largest outbound investment to date. The U.S. was second: After a weak 2011, Chinese investment here shattered the old annual record with over $14 billion spent (including a $4.2 billion acquisition late in the year). North America drew a full 40 percent of Chinese non-bond investment in 2012."


Perhaps the most controversial and widely misunderstood aspect of the US-China economic relationship is the issue of Chinese purchases of US Treasury securities, with many commentators arguing that it represents a Chinese advantage over the US.  As Hillary Clinton said: "How do you deal toughly with your banker?"  Fortunately for the US, this 'problem' is overblown. Indeed, reduced Chinese purchases of US Treasury securities would be good, rather than bad, for the US. As the graphic makes clear most Treasuries are held by Americans anyway. For an explanation of China's Reserves see here and here


Friday, May 10, 2013

Recession and Recovery in the OECD

This from Macleans. Everyone else in the world knows Australia has done better than any other developed country after the global crisis, just not the right-wing ideologues like Judith Sloan, Adam Creighton and virtually everyone else at The Australian, who it seems are immune to statistical information and analysis related to events. 


To work out the relevance of location on the graph you need to know that being in the top right corner is a good thing because it means that the downturn in Australia was not very deep, initially because of Rudd government fiscal policy and Reserve Bank monetary policy and subsequently because of continuing demand from China.

The vertical axis measures the depth of economic downturn and the horizontal axis measures the strength of recovery from the pre-crisis peak of each country.