Showing posts with label Australia's trade with Asia. Show all posts

Wednesday, September 17, 2014

China's Proposed Import Bans on Thermal Coal: Not the Real Problem Facing Australia

The Chinese government has announced that it is going to limit certain coal imports from next year. The Sydney Morning Herald reports:
The Chinese government is to limit the use of imported coal with more than 16 per cent ash and 3 per cent sulphur from January 1, 2015 in a bid to improve air quality, especially in cities such as Beijing and around Shanghai.
According to one analyst: ''[Australian coal exports are] typically around 5500 kilocalories and 24-25 per cent ash. So we've got big problems.''

However, others are less concerned by the changes arguing that the impact on other coal exporters will be even greater.
The restrictions applied vary in stringency depending on geography ... The least stringent [restrictions] apply across the entire country and would not affect a single major Australian thermal coal exporter, all of whom would comfortably comply. However it is the most stringent which apply to the major economic zones of Beijing, Hubei, Tianjin, the Yangtze River Delta and the Pearl River Delta which are of the greatest relevance. These areas are on or close to the coast and therefore are the most prospective for Australian seaborne exported coal ... only 10% of Australian coal exports go to China, and the highly restricted region represents 42% of Chinese thermal coal imports further softening the blow. This means the amount of production likely to be affected is low.
What is clear is that we need some context to assess the impact of China's proposed restrictions and any potential damage to the Australian economy.

According to the Department of Foreign Affairs and Trade's Composition of Trade, in 2013, China was Australia’s largest export market, accounting for 31.9 per cent ($101.6 billion) of total exports of goods and services (an increase of 28.2 per cent on 2012); Japan was Australia’s second largest export market ($49.5 billion); the Republic of Korea was third largest market ($21.3 billion).

Major goods and services export markets


Coal is Australia's second biggest export, behind iron ore and in front of education related travel services.

According to another DFAT publication, from 2001 to 2011, "the value of coal exports rose from $12.5 billion in 2001 to $46.8 billion in 2011, a rise of almost 300 per cent."

Traditionally our biggest market for coal has been Japan, with China a much less significant market until recently. Between 2001 and 2011 Coal exports increased their share of exports to China but were still dwarfed by iron ore exports.


Since 2011, Chinese coal exports have more than doubled from $4.5 billion to $9.1 billion in 2013.

Australian Coal Exports 2013 


The point to note here is that China has traditionally mined a lot of coal itself, but in recent years Chinese production has been in decline with significant producers struggling.  An integral component of the restrictions, therefore, will be to encourage more Chinese coal production.

The most important point to note, however, is that there are two major forms of coal exports – thermal and metallurgical. Thermal coal is used mainly for electricity generation, whilst metallurgical coal is used in steel manufacture.

Metallurgical coal exports in 2012-13 were $22.4 billion and thermal coal exports were $16.2 billion. It is thermal coal exports that could be affected by China's bans.

Principal markets for resources and energy exports
in 2012–13 dollars


Source: BREE

The above graphs clearly show the rise in both metallurgical and thermal coal exports to China since the early 2000s, but China remains a significantly less important market than Japan for both.

A problem with the focus on the potential damage to Australian thermal coal exports from the Chinese bans is that it may miss the real problem for Australian exports over coming years. The coal sector in Australia has been in trouble for quite some time, with coal miners slashing their work forces in recent times.

One of the major vulnerabilities for Australia moving forward is the increase in the share of unprocessed raw materials exports, which have substantially increased their share of total exports since 2008 and even more so since the late 1990s.


The real danger for Australian coal exports would be similar restrictions on exports of thermal coal to Japan and South Korea. Let's face it if you want to do something about climate change and levels of pollution then restricting the growth of coal burning will be essential.

Despite the moves by the Chinese authorities, coal remains the second most important source of energy. Renewables have been growing rapidly in recent years, but their share is still depressingly low.


While coal consumption is declining in Europe and North America it is increasing markedly in the Asia-Pacific.


Source: Vox

Thermal coal burning is going to continue for quite some time yet and the Chinese restrictions will have considerably less impact than the growth slowdown in China and the decline in house building and infrastructure development.

China must lessen its investment share of GDP to rebalance its economy. It could do this in an orderly way over the next few years or it could resist the need to rebalance and face an eventual catastrophic rebalancing later in the decade. In other words, rebalancing away from investment towards consumption will occur, it just depends on when and how. Australia will be negatively affected either way.

What this means is that the decline in iron ore prices and export volumes will be way more important than a ban on thermal coal exports. Those concerned about this issue should be more worried by the general decline in commodity prices.


But it's not all gloom and doom for thermal coal. Given the Abbott government's hostility to developing solutions to climate change and to the advancement of the renewable energy sector, it's possible that coal miners may be able to expand their 75 per cent share of electricity production in Australia.  

Thursday, August 14, 2014

Importing Chinese Tourists as Exports

Australia has been exporting large quantities of resources to China in recent years. I would like to say it has transformed our economy, but in reality it has accentuated pre-existing attributes of the Australian economy. Indeed, although the policy framework shaping Australia's economic interactions has been transformed, Australia remains reliant on resources to pay our way in the world.

In the 1980s, Japanese demand for resources was followed by a significant increase in Japanese investment and tourists. This is now happening with China and the prospects for further increases in Chinese tourism are high. 

Our importing of Chinese nationals to visit Australia is registered in the national accounts as an export as is the spending of Chinese students. 

Alan Kohler canvasses the potential numbers:
In June about five Boeing 747 loads of seasonally adjusted Chinese tourists arrived in Australia every day. For the year to June, the total was 769,000 -- a record number -- and second only to New Zealanders. More importantly, Chinese tourists stay the longest and spend by far the most: $5.1 billion in the year to March, according to Tourism Australia data, or $7,343 each -- double what the Kiwis spend. 
Apparently only 5 per cent of Chinese actually own a passport so there is a fair bit of upside potential there, although it's important to note that most Chinese are still poor. Despite China's rapidly growing economy over recent years, overall China is still a poor country, ranking 82nd in the world for Gross National Income per Capita (measured in US dollars) according to the World Bank. This puts it just above Namibia, but below Iraq and Turkmenistan. Australia ranks third.

In the case of tourism, purchasing power parity rankings of economic weight (see here for explanation) have less purchase than exchange rate measures (local currencies converted to US Dollars) because going overseas requires you to convert your money and pay higher prices. I'm not sure that poor Chinese will be visiting expensive rich countries any time soon.  Of course, with a population as large as China's, this is not really the point as long as the middle class keeps expanding and decides to spend some of its new found wealth on coming to Australia.

According to The Economist: 
Nearly one in ten international tourists worldwide is now Chinese, with 97.3m outward-bound journeys from the country last year, of which around half were for leisure. Chinese tourists spend most in total ($129 billion in 2013, followed by Americans at $86 billion) and per tax-free transaction ($1,130 compared with $494 by Russians). More than 80% say that shopping is vital to their plans, compared with 56% of Middle Eastern tourists and 48% of Russians. They are expected to buy more luxury goods next year while abroad than tourists from all other countries combined.
Supposedly, the number of Chinese tourists will double by 2010 and their spending will triple, although there is no indication how these numbers were arrived at. It's China so anything I suppose is possible.

Tourism Australia reports that there were "6.6 million visitor arrivals for year ending June 2014, an increase of 7.9 per cent relative to the previous year". China ranked second behind New Zealand with the UNited Kingdom third.


The Australian Bureau of Statistics compares 2013-14 with 2003-04 to see how short-term visitor arrivals have changed. Seemingly, the Japanese are less interested than they once were in Australia.


New Zealand numbers have increased by over 30 per cent, but the number of Japanese visits has fallen from 718,600 to 323,700, a fall of 55 per cent. Chinese visits have increased by nearly 230 per cent, while Indian visits have increased by nearly 250 per cent.

It is not just short-term visitor numbers that interest Australian authorities. In recent years, Australia has introduced 'significant investor visas', which enable people to buy their way into Australia. According to a recent report, the scheme "has reaped a total $1.7 billion to date", awarding 343 residency visas as at the end July 31. The Abbott government accelerated the scheme after concerns that the program begun in 2012 was not attracting investors. Accordingly "six hundred and two additional applications had been made at July 31, and $3.05 billion in investment pledged in return

Australia has been in a good location to take advantage of Asia's booming economy, although we should be careful about assuming that these numbers will continue to expand, just because Japan and China have large populations. Australia will continue to depend on the economic growth of East Asian countries with China increasingly important for all countries in the region. A slowing China will affect all other countries in Asia and in turn have a negative affect on Australia.   

Wednesday, July 17, 2013

Chinese GDP and Trade: Bad News for Australia?

The charts below are from ANZ Research. There is good chart coverage of the latest stats on the Chinese economy. Here are a few that I think show some problems ahead for the Australian economy.

The first show the slowing of growth in the Chinese economy. Michael Pettis argues that the rebalancing of the Chinese economy will probably mean that growth will slow to between 3-4 per cent.  While some have argued that there is a social stability rate of growth above 6 per cent, if the consumption increases (due to rising wages and transfers) while investment declines it is likely that this slowing rate of overall growth will not necessarily be bad for Chinese workers.


Contrary to some perceptions that China is an export-led economy, it is actually an investment-led economy. This means that if investment declines, in the short-term at least, growth will slow, because consumption will not be able to take up the slack in the short-term. The rebalancing of the economy away from increasingly unproductive investment to consumption is unlikely to be quick or smooth. As the chart below shows, consumption actually declined in recent times.

As investment slows and consumption increases in China, Australia may eventually be able to take advantage of China's growing middle class, but it won't see levels of demand to match recent years' demand for resources.


Friday, March 9, 2012

Australia's Trade and Financial Performance

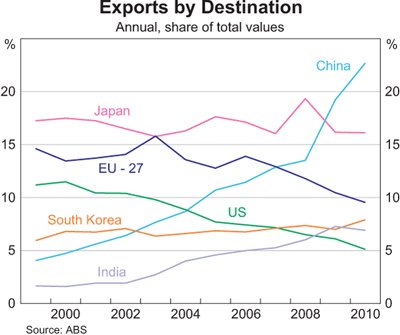
Australia's trade performance has been marked by a shift back towards resources since the early 2000s, with a remarkable shift in trade towards China over the past 10 years from under 5% to about 27% today.

This bonanza is reflected in Australia's terms of trade. 


The terms of trade is an index-measure ratio of the average price level of exports to the average price level of imports. It effectively reflects the capacity of a given quantity of exports to pay for a given quantity of imports, and provides an important indication of the strengths and weaknesses of the economic structure. A rising or falling terms of trade indicates the possibility of improving or declining living standards, because if what we sell earns relatively more than what we buy, we will be relatively wealthier. Because the terms of trade is a ratio, increases can be a result of export prices increasing at a greater rate than import prices, or export prices increasing while import prices are declining, or export prices declining at a slower rate than import prices. Of course, a rising terms of trade doesn’t stop us from buying more things than we sell, which we have made a habit of for much of our history! Improvements in the terms of trade are not reflected in GDP figures, but improvements do contribute significantly to increases in national disposable income.
 
Most commentators now think that the terms of trade has peaked and this appears more clearly in commodity prices. The terms of trade has provided a big income boost to Australia, which is not directly measured in GDP growth figures, but obviously higher income eventually has an impact on growth. Alongside the paying off of debt and the end to the effective increase in real income that comes from a higher exchange rate and lower import prices, these factors makes for a less favourable outlook for Australians over the coming year.


Note the rapid ascent of China as a share of the total and the less dramatic, but still significant growth of India's share. Compare this to the decline of the EU and US shares.


The increase in the volume of bulk commodity exports is a major factor, although the major influence on income has been the increase in prices rather than the increase in volumes.


One of the consequences of the resources boom has been an amazing growth in the level of mining investment. Given that Australia's mining sector is 80 per cent foreign owned (according to the RBA), much of this investment comes from overseas and much of the profit (eventually) also goes overseas. This negative impact on the current account deficit is offset by the positive impact of increased resource exports.

Remember that current account deficits (CADs) can be viewed in two ways (see here for explanation). While both are correct, how commentators measure them is sometimes indicative of ideological proclivities or agendas. For those worried that Australia doesn't generally export enough to cover its imports, the current account deficit is seen as the trade deficit plus the income deficit, which measures the balance of interest and dividend payments away from Australia. The mining sector is a case in point. Given that it is 80 per cent foreign owned a good deal of profits (dividends) flow out of the country. Also give that Australia has a huge foreign (private) debt, a lot of interest payments must be made to foreigners. In this interpretation of the CAD, the solution is to increase exports and cut foreign borrowing. The formula for this version is:  

CA = X - M + NY + NCT

X = Exports of goods and services
M = Imports of goods and services
NY = Net income abroad
NCT = Net current transfers

Remember that the current account can be a CAS i.e. a current account surplus. For the world as a whole deficits and surpluses must match unless we start trading with another planet. See here for further explanation.


The other way of viewing the CAD is to see it as the difference between saving and investment. This is the way most economists, especially Treasury and the RBA prefer to view the CAD because it is an accounting identity. Now obviously the two formulae can be reconciled, but I won't bore you with the details here. 

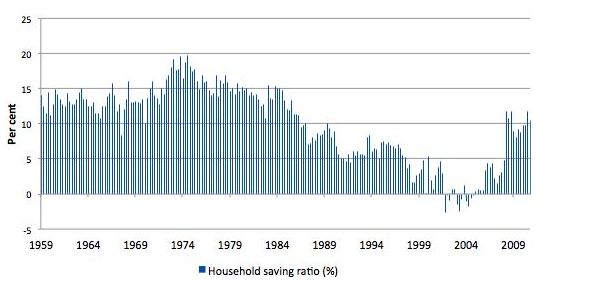
The CAD = Saving - investment approach is also preferred as an explanation because it correctly implies that Australia's CAD is driven by high investment in the mining sector, rather than low saving. Indeed Australian saving has returned to more normal levels since the GFC after a period of negative saving. 


This is from the latest ABS quarterly accounts. 


A longer term view is provided by Bill Mitchell, which shows that saving patterns are simply returning to earlier levels. 


Now if saving increases, this should mean that more Australian investment can be funded domestically, but we are currently going through the biggest mining investment boom in our history. (What is most interesting about this boom is that there is both a massive terms of trade boom and a massive investment boom at the same time). 


The following graph from RBA Deputy Governor Philip Lowe shows just how big is that investment surge.


As a consequence it is not surprising that Australia's foreign financial liabilities remain high.


Tuesday, September 6, 2011

Dreams and Nightmares

I've recently written a very long paper on Australian-Asian relations called Dreams and Nightmares: Australia's Past, Present and Future in Asia. It was written for the Institut français des relations internationales (it's in English).


Friday, July 15, 2011

A Long-Term View of Australian Exports

I'm currently finalising an article on Australian-Asian relations and the editors wanted me to include some data on Australian trade to show how Australia's trading relationships have shifted to Asia. One of the best sources is Brian Pinkstone's Global Connections, published many years ago and its data is not recent enough for my purposes.

Another problem is that most long-term data is for merchandise (or goods trade) and does not, therefore, include services trade, which accounted for 18.4 percent of total exports in 2010. So our long-term comparison here is for goods exports. (I'd love to hear from someone who has a long-term data series for goods and services exports and imports).

What I'm interested in here is the percentage of total exports (the data is also available for imports, but I do have some sort of social life so I will leave that for another day). This means that care needs to be taken in analysing the tables and graphs to realise that changing shares do not necessarily represent increases or decreases in trade.

For example while Japan's share of total trade may have fallen, it doesn't mean that trade with Japan has fallen. Indeed, while Japan's share of exports fell, total exports to Japan continued to grow rapidly in dollar terms. To avoid this misperception you can go to the original data sources to see absolute figures in dollar terms.

Presenting this data in graphic form is particularly illuminating, showing how much China's trade share has grown in recent years, how rapid Japan's trade share grew from the 1960s and how the UK went from almost total domination of Australia's exports to relative insignificance. What also interested me was how important exports to France had been in the early part of the 20th century (reaching as high as 14.25 percent in 1910.

The total trade figures also reveal how disastrous the Great Depression was for Australian trade with the dollar amount of trade dropping from $327,604 (converted form pounds) in 1920-21 to $121,919 in 1930-31. Could a disaster like this ever again hit the world and Australia? While trade fell rapidly during the recent crisis, it recovered relatively quickly, especially in Asia.


Australia’s Major Merchandise Export Markets 1901-2010
Percentage of Total Merchandise Trade


Sources: Author's calculations based on DFAT (2002) Direction of Trade Time Series 2000-01 One Hundred Years of Trade, February <http://www.dfat.gov.au/publications/stats-pubs/DOTTS.pdf> and DFAT (2011) Composition of Trade 2010, June <http://www.dfat.gov.au/publications/stats-pubs/cot-cy-2010.pdf>. 

For those of you whose eyes glaze over at a table like this, I have included some graphs to make the picture clearer.

Australia’s Major Merchandise Export Markets 1901-2010
US, UK, China, Japan, Korea and India 


I have separated out the various graphs to make the comparisons clearer.

Our reliance on the United Kingdom for the first 30-50 years of the 20th century is astonishing. The UK accounted for almost 90 per cent of trade in 1930-31. The importance of exports to the United States during the war and after during the occupation of Japan and the war in Korea is also clear from the figures for 1940-41 and 1950-51.

Australia’s Major Merchandise Export Markets 1901-2010
US and UK


Japan's rising share begins in the post-war period and grows over the 1950s and 1960s as the UK's share declines. Its share plateaus after this as the rest of Asia becomes more important from the 1970s onwards. China's rapidly growing share of trade in the first 10 years of the 21st century is truly astounding.

Australia’s Major Merchandise Export Markets 1901-2010
 China and Japan


And while many are excited about India's rise, South Korea is often underplayed as an essential trade partner.

 Australia’s Major Merchandise Export Markets 1901-2010
India and South Korea


Finally a comparison of our dependence on Britain and dependence on Japan is made clear by the following.

Australia’s Major Merchandise Export Markets 1901-2010
China and the United Kingdom 


For those interested in the current state of play for goods and services, DFAT provides figures for calendar year 2010.