Showing posts with label world trade. Show all posts

Wednesday, July 17, 2013

Chinese GDP and Trade: Bad News for Australia?

The charts below are from ANZ Research. There is good chart coverage of the latest stats on the Chinese economy. Here are a few that I think show some problems ahead for the Australian economy.

The first show the slowing of growth in the Chinese economy. Michael Pettis argues that the rebalancing of the Chinese economy will probably mean that growth will slow to between 3-4 per cent.  While some have argued that there is a social stability rate of growth above 6 per cent, if the consumption increases (due to rising wages and transfers) while investment declines it is likely that this slowing rate of overall growth will not necessarily be bad for Chinese workers.


Contrary to some perceptions that China is an export-led economy, it is actually an investment-led economy. This means that if investment declines, in the short-term at least, growth will slow, because consumption will not be able to take up the slack in the short-term. The rebalancing of the economy away from increasingly unproductive investment to consumption is unlikely to be quick or smooth. As the chart below shows, consumption actually declined in recent times.

As investment slows and consumption increases in China, Australia may eventually be able to take advantage of China's growing middle class, but it won't see levels of demand to match recent years' demand for resources.


Tuesday, July 16, 2013

Import Share of China's Exports


I'm putting together my Course Guide for a subject called Power in East Asia and came across this - OECD/WTO TRADE IN VALUE-ADDED (TIVA) DATABASE: CHINA - in my list of new material.

Basically the data shows that Chinese exports include a large amount of foreign content reflecting the fact that China is often at the end of the value chain.

The main findings are:
The bilateral trade surplus with the US is about 25% lower in 2009 in value-added terms. Interestingly, a significant factor behind this is the relatively higher imports of US value-added.  
China is well connected to other economies as a hub in "factory Asia": gross exports incorporate a large share of foreign value-added and nearly half of all imported intermediates are used as inputs for exports.  
While China is strong in manufacturing industries, the role of services should not be neglected: 30% of Chinese gross exports correspond to value-added from services industries and in sectors such as electronic goods, 30% of the value exported also comes from services. 
If trade is measured on a value-added basis the US trade deficit is smaller because:
As a final assembler, China relies on intermediate goods and services that are for a significant share imported from the US or that incorporate value-added from the US. China has also moved upstream in some value chains and exports intermediate inputs used by third countries that export to the US.


In some industries as much as 40 per cent of exports are accounted for by foreign value-added content.

Many of China's imports are then exported. In several industries the share of imported intermediate inputs that are exported is greater than 50 per cent, with the average of all industries just under 50 per cent.  Over 80 per cent of textiles and apparel intermediate imports are exported and over 70 per cent of electrical equipment intermediate imports are exported.

Tuesday, May 14, 2013

The US-China Economic Relationship in Pictures

This from the US-China Business Council ... Well worth a read to break down a few myths about US-China relations.

Firstly, US exports to China have grown  at a far greater rate than US exports to the rest of the world.


 The next biggest growth market is Brazil, which has grown at 180% compared to 542%.


Not surprisingly Canada is a far more important export market for the US, followed by Mexico. See geography does still matter, despite the guff written about the "end of geography" in the 1980s. 


To prove its point about the continuing domination of the US economy, the authors use the USD exchange rate measure of economic weight. As I argue in How Big, How Rich and How Developed? The State of Play in the World Economy:
How we measure economies matters. To get a clearer picture of the world economy we need to look not only at size, but wealth, development and distribution. But even when measuring the size and wealth of economies, the method of measurement we choose will have a big impact on the outcome. ...
There are two ways to measure the size of economies. Firstly, we can convert the value of a country's gross domestic product (GDP) into US dollars and compare it to the GDP of other countries whose currencies have been converted into US Dollars also.  ... When exchange rates do vary considerably over time, such as the dollar–yen exchange rate after the 1970s, this method may cause distorted measures of size. ...
Such discrepancies have led to the increased use of an alternative method of measuring the size of economies based on the concept of purchasing power parity (PPP). Statisticians measure purchasing power within individual economies and then make comparisons on that basis. PPP measures GDP adjusted to reflect different costs of living and production within different economies. As most travellers know, goods and services and production costs are considerably lower in some countries than they are in others.


One should be very cautious about this projection, which seems to animate Australian policy-makers as well. It could turn out to be true, but before 2020 China is likely to suffer a big slowdown in growth, which might make these "middle class" growth projections come unstuck.


This is the one that would surprise most people. Although value-added measured via purchasing power parity would show a significantly different result I would think. Other analysts argue that the Chinese manufacturing sector surpassed the US manufacturing sector in terms of value-added late last decade. Remember too that value-added is just one way to measure the size of the sector (although it is perhaps the most important measure). China does a good deal of assembling still, but as wages increase these assembling operations will increasingly shift to elsewhere in Asia and perhaps Latin America.


Given the still very large US manufacturing sector it is not surprising that US companies' manufacturing assets are located mainly in the US itself.


Chinese foreign direct investment (non-bond investment) in the US has grown rapidly in recent years, but to put the level of Chinese FDI in the US into context, it is roughly the same as Chinese FDI in Australia.

As The Heritage Foundation reports: "The leading recipients of Chinese non-bond investment since 2005 have been Australia and the U.S. Other major recipients are Canada, Brazil, Britain, and Indonesia. In 2012 alone, Canada topped the list, thanks to the Chinese CNOOC's $15.1 billion acquisition of Nexen, the largest outbound investment to date. The U.S. was second: After a weak 2011, Chinese investment here shattered the old annual record with over $14 billion spent (including a $4.2 billion acquisition late in the year). North America drew a full 40 percent of Chinese non-bond investment in 2012."


Perhaps the most controversial and widely misunderstood aspect of the US-China economic relationship is the issue of Chinese purchases of US Treasury securities, with many commentators arguing that it represents a Chinese advantage over the US.  As Hillary Clinton said: "How do you deal toughly with your banker?"  Fortunately for the US, this 'problem' is overblown. Indeed, reduced Chinese purchases of US Treasury securities would be good, rather than bad, for the US. As the graphic makes clear most Treasuries are held by Americans anyway. For an explanation of China's Reserves see here and here. 


Tuesday, September 18, 2012

The World's Most Important Economic Relationship? US-China Trade and Investment

The economic relationship between the United States is one of the world's most important. The trade balance is considerably in China's favour and is matched by huge Chinese purchases of US debt securities. Although it has grown significantly in recent years, Chinese foreign direct investment (FDI) in the United States is still negligible at considerably less than one percent and US FDI in China constitutes about 10 per cent of the total.

While it is true that US-China trade as a percentage of China's total trade has been in decline over recent years, the United States and Europe (i.e. most of the developed market economies) remain key elements of final demand for products exported from China, but often sourced from other countries in Asia and from the United States itself.


The Trade Relationship

The trade relationship is marked by tensions as politicians in the United States seek to blame China for US economic woes. A Romney ad states: "It’s time to stand up to the cheaters and make sure we protect jobs for the American people." Meanwhile an Obama ad responds: "Romney’s companies were called pioneers in shipping U.S. manufacturing jobs overseas. He invested in firms that specialized in relocating jobs to low-wage countries like China. Even today part of Romney’s fortune is invested in China. Romney’s never stood up to China. All he’s done is send them our jobs."

Mutual suspicions about security issues increase the potential for economic conflict. But generally candidates are more critical during election campaigns, downplaying the rhetoric and action when in office.

US merchandise trade with China have grown markedly in importance since 1980 as the table below makes clear. [trade figures are generally divided into merchandise and services trade and services trade figures are often not included even though this is often unstated.]

The United States and China trades reestablished diplomatic relations and signed a bilateral trade agreement 1979, while most-favored-nation (MFN) status was granted in 1980.


In 2011 merchandise exports to China increased to $103.9 billion, up 13.1% over 2010 levels.  China is now the United States' 3rd most important export market, replacing Japan after 2007.


According to Morrison
From 2000 to 2011, the share of total U.S. exports going to China rose from 2.1% to 7.0%. The top five merchandise U.S. exports to China in 2011 were waste and scrap, oilseeds and grains, aircraft and parts, semiconductors and other electronic components, and motor vehicles  China is also a significant market for U.S. exports of private services, which totaled $21.1 billion in 2010 (the most recent year available), which was a 35.3% increase over 2009 levels, making China the seventh-largest export market for U.S. private services.
This means, according to the US-China Business Council (from Morrison) that the "total market for the sale of U.S. goods and services in China (i.e., U.S. exports and sales by U.S.-invested firms in China) could be as high as $200 billion annually." [For up-to-date statistics see the US Census Bureau Stats on Foreign Trade].

The Office for the United States Trade Representative reports that:
U.S. goods and services trade with China totaled $539 billion in 2011. Exports totaled $129 billion; Imports totaled $411 billion. The U.S. goods and services trade deficit with China was $282 billion in 2011. China is currently our 2nd largest goods trading partner with $503 billion in total (two ways) goods trade during 2011. Goods exports totaled $104 billion; Goods imports totaled $399 billion. The U.S. goods trade deficit with China was $295 billion in 2011. Trade in services with China (exports and imports) totaled $36 billion in 2011 (preliminary data). Services exports were $25 billion; Services imports were $11 billion. The U.S. services trade surplus with China was $13 billion in 2011.


While US exports to China have slowed in recent years in comparison to US trade with the rest of the world over the 10 years from 2002-2011 "U.S. exports to China increased by about 471% (the overall growth in U.S. exports over this period was 213.6%)."

According to the US-China Business Council, the United States was China's biggest trading partner and export market and the 4th biggest import source in 2010.


 However, while China is only the third largest export market for the United States, the US deficit with China is by far and away its biggest deficit.


This headline figure fuels the ire of American protectionists, but masks the extent to which China's 'exports' are re-exports from elsewhere. The iPhone provides a neat illustration of this distortion. According to Yuqing Xing
Using the total manufacturing cost $178.96 as the price of the iPhone, China’s iPhone exports to the US amounted $2.0 billion in 2009. Assuming that the parts supplied by Broadcom, Numonyx and Cirrus Logic, valued at $121.5 million, were imported from the US the iPhone alone contributed $1.9 billion trade deficit to the US, about 0.8% of the US trade deficit with China ...
But 
most of the export value and the deficit due to the iPhone are attributed to imported parts and components from the third countries and have nothing to do with China. Chinese workers simply put all these parts and components together and contributed only $6.50 to each iPhone, about 3.6% of the total manufacturing cost (e.g. the shipping price). The traditional way of measuring trade credits all $178.98 to China when an iPhone is shipped to the US, thus exaggerating the export volume as well as the imbalance. Decomposing the value added along the value chain of the iPhone manufacturing suggest that, of the $2.0 billion iPhone export from China, 96.4% is actually the transfer from Germany ($326 million), Japan ($670 million), Korea ($259 million), the US ($108 million) and others ($542 million). All of these countries are involved in the iPhone production chain.
If China’s iPhone exports were calculated based on the value added, i.e., the assembling cost, the export value as well as the trade deficit in the iPhone would be much smaller, at only $73 million, just 3.6% of the $2.0 billion calculated with the prevailing method.
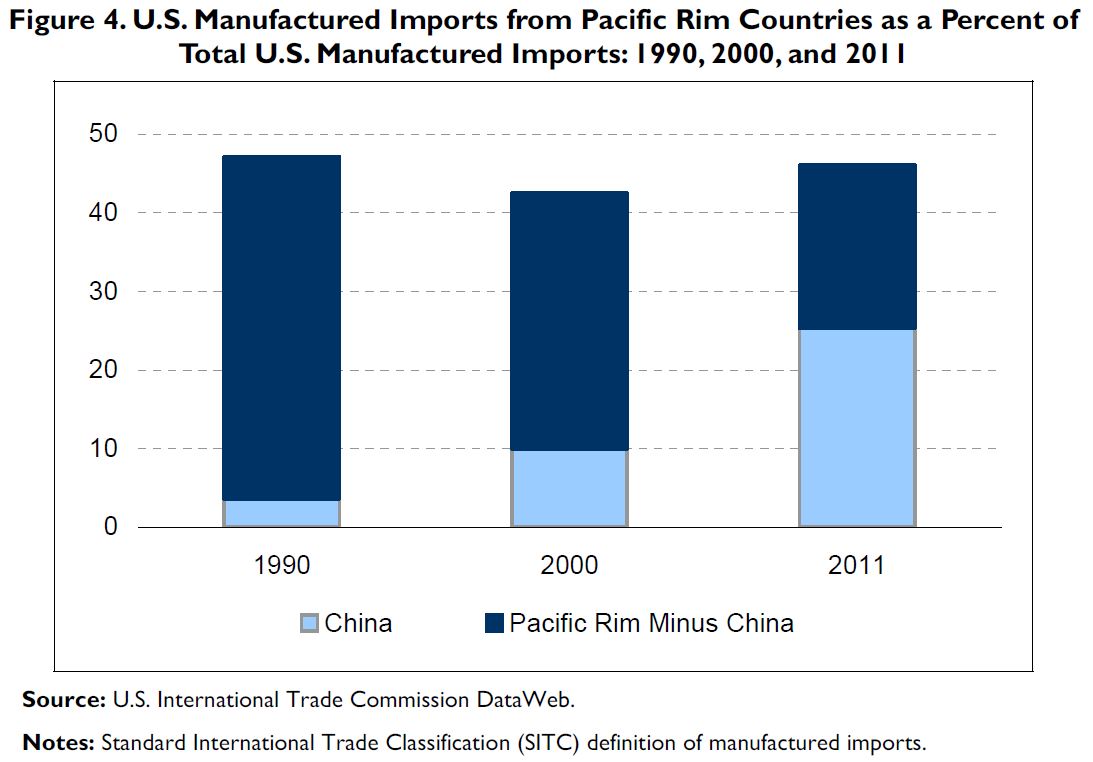
Morrison also points out that US trade with China has mainly replaced trade with other Pacific Rim countries. [Pacific Rim countries include Australia, Brunei, Cambodia, China, Hong Kong, Indonesia, Japan, South Korea, Laos, Macao, Malaysia, New Zealand, North Korea, Papua New Guinea, the Philippines, Singapore, Taiwan, Thailand, Vietnam, and several small island nations.] In terms of manufactured imports in 1990 47.1% of the value came from Pacific Rim countries (including China), while in 2011 the same countries accounted for 46.1% of the total.  US manufactured imports from China increased from 3.6% to 25.3% over the same period!


While the US-China trade relationship is an important component of each country's trade, the US does not have as much to lose as other countries if Chinese growth slows. Chinese imports make a significant contribution to growth of a wide range of countries, including Australia.


According to Mackenzie "0.6 percentage points of Germany’s 3 per cent GDP growth for 2011 — or, about a fifth — was courtesy of its exports to China ... There’s a certain irony here in that Germany is simultaneously importing less from some eurozone peripherals, to a degree that could be harming their prospects of recovery." For the United States "Chinese imports also contributed to 0.1 percentage points" of 1.7 per cent GDP growth in 2011, which while appearing like an insignificant number is actually "almost 6 per cent of US GDP growth."

When considered in terms of share of total exports, Australia is the second most Chinese-dependent economy in the world. And as I've argued before, the negative impact on Australia of a growth slowdown in China will be felt indirectly as well through the impact on our second and third largest export destinations Japan and Korea. (China accounted for 24.6%, Japan 16.7% and Korea for 8.0% of total exports in 2011)


Similar to Australia, US policy-makers and business people see great potential for future trade with China as it becomes richer and as a growing middle class demands more advanced goods and services. Morrison cites a 2009 Boston Consulting Group report arguing that "China had 148 million 'middle class and affluent' consumers, defined as those whose annual household income was 60,000 RMB ($9,160) or higher, and that level is projected to rise to 415 million by 2020."
Although Chinese private consumption as a percent of GDP is much lower than that of most other major economies, the rate of growth of Chinese private consumption has been rising rapidly. For example, private consumption as a percent of GDP in China in 2011 was 34.0%, compared to 71.1% in the United States. However, the annual rate of growth in Chinese private consumption from 2002 to 2011 averaged 8.0%, while the U.S. annual average was 1.9%. 

The Investment Relationship

The investment relationship is also very significant for both countries and the wider world. A majority of Chinese investment in the United States is in public and private securities (including, according to Morrison, U.S.Treasury securities, U.S. government agency (such as Freddie Mac and Fannie Mae) securities,
corporate securities, and equities (such as stocks)." U.S. Treasury securities "are the largest category of U.S. securities held by China". Most US investment in China is foreign direct investment (investment of greater than 10 per cent in a company).

China's holdings of Treasuries "increased from $118 billion in 2002 to $1.15 trillion in 2011", although holdings declined by 0.7% in 2011. China replaced Japan as the largest holder of Treasury securities in 2008.


There is considerable debate about whether this ownership of treasuries gives China influence over China or whether it signals a so-called balance of financial terror. I've written before about these claims here and here, based on the work of Michael Pettis. To summarise, such claims are overblown. As Pettis points out: 
As long as China maintains its own currency and denominates all domestic transactions in RMB, the PBoC reserves cannot be used in China. They cannot go to pay doctors’ salaries, to build bridges, to lower taxes or to subsidize consumption. They can only be used to purchase or pay for things from outside China. This means that reserves ensure that China can import foreign commodities and other goods as long as it can pay for them domestically. It also means that the PBoC can ensure the availability of dollars to repay foreign debt and foreign investment.  ...
The US government does not need foreign buyers for its bonds. On the contrary, it is in Washington’s best interest that foreign central banks sharply reduce their purchases of USG bonds.
According to Murray and Labonte foreigners owned 56.9% of federal govt debt at the end of 2011, up from 53.5% at the end of 2007.

China holds the largest percentage with 23.1 per cent, followed by Japan with 21.2 per cent. The Luxembourg and Caribbean Banking centres are probably fronts for Middle Eastern buyers and Hedge Funds and in the past China has bought Treasuries through companies operating out of London.


Compared to the amount of foreign investment in securities FDI between the two countries is very small.

The Office of the United States Trade Representative reports that:
U.S. foreign direct investment (FDI) in China (stock) was $60.5 billion in 2010 (latest data available), a 21.4% increase from 2009. U.S. direct investment in China is led by the manufacturing and banking sectors. China FDI in the United States (stock) was $3.2 billion in 2010 (latest data available), up 171.6% from 2009. China direct investment in the U.S. is led by the wholesale trade sector.
The total stock of FDI in the US in 2010 according to UNCTAD's 2012 World Investment Report was $3,397 billion, which means that the stock of Chinese FDI in the United States as a percentage of the whole was 0.09%.

According to Morrison, the Bureau of Economic Affairs (the US equivalent to the ABS) adds FDI from China and for China through offshore centres such as Hong Kong and designates this calculation the “ultimate beneficial owner” (UBO) of FDI. This increases the amount of "China’s cumulative FDI flows to the United States through 2010 by 86% to $5.8 billion."

If we use this enhanced figure it means that China's percentage of  total FDI was 0.17% in 2010.

Even this UBO figure "would rank China as the 30th-largest source of total FDI in the United States through 2010.
The Rhodium Group (a private research consultancy and advisory company) estimates cumulative Chinese FDI flows to the United States through the end of 2010 at $11.7 billion and that the amount of new Chinese FDI in the United States in 2010 was $5.2 billion. 
Accepting this higher figure would mean that, like Australia, recent increases in Chinese FDI in the United States are significant but from a very low base. To put the US figure in context, the total stock of Chinese FDI in Australia at the end of 2011 was AUD13.3 billion.

US FDI in China ($60.5) billion as a percentage of the total stock in 2010 ($587.8 billion) was 10.3% of the total.


Conclusion

There is no doubt that Asia has outperformed the rest of the world over recent years. But the pertinent question to ask is whether it can continue to perform well if growth stays anaemic in Europe (the world's most important economic region), the United States (the world's largest economy) and Japan (the world's third largest economy). As Michael Pettis argues in his latest newsletter, what the world needs form China at the moment is not more growth, but more net demand.

A rebalancing Chinese economy that grows at a slower rate but a shift in wealth towards households will be good for the United States, but perhaps bad for Australia.


Wednesday, December 15, 2010

The fall and rise of world trade

The IMF's Finance and Development Journal is a good source of information and data on the world economy. And despite what some on the Left might think it's fairly balanced as well.

The latest edition provides some data on the fall and rise of exports of the top 10 exporters and provides some info on why Australia has done better than many other countries.


Before the crisis - from 2000-08 - China's exports grew by 700 per cent.

But as the graph shows, its exports dropped substantially during 2008-09. For the top 10 exporters, which account for 50 per cent of world trade, exports dropped by 34 percent between October 2008 and March 2009. But by "the second quarter of 2010, the top 10 exporters had recovered 55 percent of their decline during the crisis."

Indeed, China's exports have nearly recovered their 2008 peak.

Perhaps of more interest for Australia is the import side of the equation, which shows that China's imports have surpassed their 2008 peak. The US, however, stuck as it is in its financially induced mire has recovered, but still has a long way to go before it regains its 2008 peak.

The real question is whether this disparity will eventually matter for the world economy and for China (and Asia) in particular, i.e. can China's trade continue to boom if the US and Europe continue to lag with imports. Overall the recovery in imports of the top 10 has been substantial. According to the IMF:
During 2000–08, the top 10 importers—who bought about 50 percent of world imports—increased their foreign purchases by 51 percent, with the United States the clear leader. As with exports, the financial crisis caused a significant drop in imports of 35 percent during the same six-month period—October 2008 to March 2009. But there was a similar sharp rebound in imports. By the second quarter of 2010, the top 10 importers had recovered 58 percent of the crisis-induced decline.
Another interesting visual from this graph illustrates that the US has once again surpassed Germany as the second biggest exporter with the German export recovery faltering slightly in early 2010.

Wednesday, November 24, 2010

Rethinking World Trade

In a recent speech, rather dully titled "Globalization of the Industrial Production Chains and Measuring International Trade in Value Added", the Director General of the World Trade Organisation Pascal Lamy made some points that I've been talking about with students in my course Political Economy of East Asia (a title I want to change to "Power in East Asia" to get more students!).* Lamy is concerned that traditional trade statistics skew the real picture of international trade, particularly the bias towards the country where the final product is shipped from, even if it is simply assembled there. He uses the example of the iPOD to make his case.
What we call “Made in China” is indeed assembled in China, but what makes up the commercial value of the product comes from the numerous countries that preceded its assembly in China in the global value chain, from its design to the manufacture of the different components and the organization of the logistical support to the chain as a whole. ... If we continue, in this context, to base our economic policy decisions on incomplete statistics, our analyses could be flawed and lead us to the wrong solutions.
For instance, every time an iPod is imported to the United States, the totality of its declared customs value (150 dollars) is ascribed as if it were an import from China, contributing a bit more to the trade imbalance between the two countries. But if we look at the national origin of the added value incorporated in the final product, we note that a significant share corresponds to reimportation by the US, and the rest to the bilateral balance with Japan or Korea which should be allocated according to their contribution to that added value. In fact, according to American researchers, less than 10 of the 150 dollars actually come from China, and all the rest is just re exportation. In the circumstances, a re evaluation of the yuan — a topic which is very much in vogue these days — would only have a modest impact on the sales price of the final product and would probably not restore the competitiveness of competing products manufactured elsewhere.
Similarly, the statistical bias created by attributing the full commercial value to the last country of origin can pervert the political debate on the origin of the imbalances and lead to misguided, and hence counter-productive, decisions. Reverting to the symbolic case of the bilateral deficit between China and the United States, a series of estimates based on true domestic content cuts the deficit by half, if not more.
He then goes on to make an important point about the US trade deficit with Asia rather than particular countries.
This impression is confirmed by other figures, if we accept to “debilateralize” them: if we look at the US trade deficit with Asia rather than its bilateral deficit with China, we note a remarkable stability over the past 25 years at something like 2 to 3 per cent of the United States’
Increased trade with China has replaced trade with other parts of Asia, but this hasn't necessarily been as negative for the rest of Asia as this simple statement might imply. This is because the rest of Asia has also increased its exports with China, developing what is an increasingly important global production structure.

One of the remarkable facts that proponents of the argument that a higher Yuan will rebalance US-China trade need to think about is in relation to US trade with Japan. Though the Yen strengthened remarkably against the Dollar, from 360 yen to the dollar in the 1970s to as low as 80 to the Dollar in the mid-1990s, the trade deficit with Japan just kept on increasing.

File:JPY-USD 1950-.svg
JPY-USD Exchange Rate
http://en.wikipedia.org/wiki/File:JPY-USD_1950-.svg

For a  discussion on currency issues see Yipang Huang "A Currency War the US Cannot Win". (See also Martin Wolf "Why America is Going to Win the Global Currency Battle".)

Huang makes the point that:
Experts who are interested in Plaza II should first study carefully the experiences of the original Plaza Accord. The yen/dollar rate dropped from 250 in early 1985 to 150 in early 1988 and further to about 80 in mid-1995. But Japan’s current-account surpluses did not disappear.
Likewise, the real effective exchange rate of the US dollar fluctuated during the past three decades, but the US current-account deficits continued to climb, especially during the ten years preceding the global crisis. If the Plaza Accord did not achieve its original goal, why all of a sudden people became interested in this old idea again?

Now Lamy's brief is to encourage world trade liberalisation and so he has an agenda here, but it's worth thinking about his analysis, especially in relation to employment.
As for the impact on employment — understandably a rather sensitive issue in these times of economic crisis — once again the result can be surprising. Reverting to the case of the iPod, another study by the same authors estimates that on a global scale, its manufacture accounted for 41,000 jobs in 2006 of which 14,000 were located in the United States, 6,000 of them professional posts. Since American workers are more qualified and better paid, they earned more than 750 million dollars, while only 320 million less than half — went to workers abroad.
In this example, case studies have shown that the innovating country earns most of the profits; but traditional statistics tend to focus on the last link of the chain, the one which ultimately earns the least. Don’t get me wrong, I am not saying that this is always the case and that relocations always create more jobs than they destroy. ...
I simply wanted to highlight the paradoxes and the misunderstandings that arise when new phenomena are measured using old methods. Statistical survey experts know very well that “if you ask the wrong person, you will get the wrong answer”. Similarly, if you analyse a phenomenon using the wrong “measurements”, you will reach the wrong conclusions.
What Lamy proposes is a new research agenda to rethink the analysis of world trade.


*The political economy of East Asia course is part of the Bachelor of Asian Studies and Bachelor of International Relations at Griffith University.

Tuesday, August 10, 2010

China's Exports

An interesting piece by Kevin Gallagher on what he calls China's "unsustainable growth model". Most interesting is research he cites from Yilmaz Akyuz about China's exports.
The paper shows empirical evidence which suggests that in recent years the average import content of Chinese exports has been between 40 and 50 per cent. In spite of this, about one-third of growth of income in China is estimated to have been due to exports because of their rapid growth reaching 25 per cent per annum. This figure goes up to 50 per cent if spillovers to domestic consumption and investment are accounted for. The sharp contraction of exports in 2009 resulted in a swing of almost 6 percentage points from 2002-07 in their contribution to growth and this could only be partly offset by a massive intervention package.
China cannot return to pre-crisis export growth rates at a time when growth in the US and Europe is below potential, unemployment remains high and sticky, and reduction in global imbalances is seen as the key to global stability. It needs to shift from export-led to consumption-led growth and reverse the downward trend in the share of consumption in national income. This calls for a higher share of wages in value-added and significantly greater government transfers to households, and large public spending on social infrastructure.
Export dependence in most other developing economies participating in the Sino-centric East Asian production network is no less than that in China. They are vulnerable to slower expansion of markets in the US and Europe not only directly, but also through China. For these countries China cannot replace the US even if it maintained rapid GDP growth based on domestic consumption: its GDP is about one-third of the US, the share of Chinese households in GDP is much smaller, they save a much higher proportion of disposable income and the import content of household consumption is much lower than the US. These countries, even the smaller ones, cannot easily redirect their exports to third markets or absorb them domestically. They not only need to increase domestic spending but also restructure industries so as to change their product mix.

Sunday, March 14, 2010

Measuring Economic Weight

The Economist recently ran a story on putting the rise of Asia in perspective it's worth a read and is a useful corrective to many of the arguments that think the future is already here! The Balance of Economic Power: East or Famine The Economist.

There are two main ways to measure the size of economies. We can convert the value of Chinese gross domestic product (GDP), for example, into US dollars and compare it to the GDP of other countries. The advantage of this method is that it provides a neat comparison of a particular country with any other country at any particular time. But the problem with this measure is that it varies with the dollar–renminbi exchange rate and doesn’t accurately reflect the cost of things within the Chinese economy. If the renminbi was revalued this would immediately increase the measured size of the Chinese economy. This is not completely spurious because a higher valued renminbi would enable the Chinese to buy more goods and services on the international market and would increase their ability to invest in other countries. When exchange rates do vary considerably over time, such as the dollar–yen exchange rate since the 1970s, this method may be a problem. For example compare the difference in size of the Australian economy when measured at a time when the Australian dollar was 47.75c against the US dollar in April 2001 to when it reached 98.49c against the US dollar in July 2008. Although for measuring purposes the exchange rate is averaged over a period, variation still poses obvious problems.
Such discrepancies have led to the increased use of an alternative method of measuring the size of economies based on the concept of purchasing power parity (PPP). Statisticians measure purchasing power within individual economies and then makes comparisons on that basis. PPP measures GDP adjusted to reflect different costs of living and production within different economies. Goods and services and production costs are considerably less in China than they are in the United States. We all know that our currency goes further in some countries and less in others. You can live, for example, much more cheaply in Indonesia than you can in Sweden! A popular representation of PPP values is the Economist magazine’s tongue-in-cheek Big Mac Index, which compares the price of Big Mac’s around the world. A Big Mac in Sweden ($4.58) will cost you a lot more than a Big Mac in Indonesia ($1.74) or even the United States itself ($3.45). According to PPP theory, the cost of Big Macs should be the same across countries once local currencies are converted to US dollars. In these February 2009 prices, the Index suggests that the Swedish Kroner is overvalued against the dollar and the Indonesian rupiah is substantially undervalued. Big Macs are not really a good marker of PPP because they are generally considerably more expensive than local-food items in developing countries! There is also now an iPOD Index, which does the same thing, but with a high technology, tradeable item rather than a basic food item. This is significant because products that can be easily traded should, through the process of arbitrage, end up with the same price (allowing for exchange rates).

If we compare what a given amount of dollars will buy in the Chinese economy and compare it to what a given amount of dollars buys in the US economy we can, according to advocates of this approach, get a better idea of the size of an economy. The problem with this method is calculating the different costs of production and living on an ongoing basis. To do a proper analysis of PPP, the World Bank compares a large range of goods and services. It is very difficult to get a comparable basket of goods for diverse countries with substantially different cultures and consumption norms. In December 2007, the International Comparison Program co-ordinated by the World Bank revised down its PPP estimate of China’s economy by 40 per cent making a considerable difference to the measured size of the Chinese economy in 2005!

The best solution to the problem is the messy one of considering both measures together. Table 3.1 below shows that the United States accounted for 21.1 per cent of global GDP on a purchasing-power-parity basis in 2007, down from 23 per cent in 1995 and 24.5 per cent in 1980. China has rapidly caught up, accounting for 10.1 per cent in 2007 (revised down by the Bank by 6 per cent from earlier 2007 estimates!), up from 5.7 per cent in 1995 and 2.2 per cent in 1980. Measuring shares of global GDP by converting a country’s GDP to US dollars at market exchange rates produces very different results. On this basis, as Table 3.2 shows, in 2007 the United States was more than four times larger than China, accounting for nearly 25.3 per cent of global GDP, compared to 6.0 per cent for China. In 1995, according to this measure, the United States was 10 times larger than China. On an exchange basis, Japan’s relative position increased significantly between 1980 and 1995, with the increased value of the yen in the mid-1990s improving Japan’s position. On an exchange basis, Japan’s share of the world economy declined by half between 1995 and 2007. On a PPP basis, Japan’s economy has declined by a much smaller amount. These tables show that US decline has been gradual and that China’s rise has been mainly at the expense of Japan.
In 2006, the developing world accounted for more than 50 per cent of global GDP (measured on a PPP basis), signalling its growing importance. Developing countries grew at a faster rate between 1995 and 2005 than they did during the previous two decades and considerably faster than developed countries. In 2006, developing countries accounted for 43 per cent of world exports, up from 20 per cent in 1970; half of the energy consumption; and 70 per cent of currency reserves. Many see India as a major challenger to China’s mantle as the most important developing country. While China causes considerable anxiety in the developed world about its growing domination of manufacturing, India creates concerns because of its competitiveness in higher paid service and technology jobs. Outsourcing to India will increase in coming years and become even more important as a topic of debate.

But as The Economist reports:
Since 1995 Asia’s real GDP (even including less sprightly Japan) has grown more than twice as fast as that of America or western Europe. Morgan Stanley forecasts that it will grow by an average of 7% this year and next, compared with 3% for America and 1.2% for western Europe.
Yet a closer look at the figures suggests that the shift in economic power from West to East can be exaggerated. Thanks partly to falling currencies, Asia’s total share of world GDP (in nominal terms at market exchange rates) has actually slipped, from 29% in 1995 to 27% last year (see chart 1). In 2009 Asia’s total GDP exceeded America’s but was still slightly smaller than western Europe’s (although it could overtake the latter this year). To put it another way, the output of the rich West is still almost twice as big as that of the East.


As the graphic makes clear, Asia's (especially) China's growth is considerably more significant when it comes to measurements based on PPP. China's currency is kept artificially low and if allowed to rise China would increase its economic weight, but at the same time it would slightly undermine China's export growth potential as Chinese exports became relatively dearer on global markets.

So what about Asian exports? The Economist reports
the region’s 31% share of world exports last year was not much higher than in 1995 (28%) and remains smaller than western Europe’s. Indeed, the shift towards Asia appears to have slowed, not quickened. Its share of world output and exports surged during the 1980s and early 1990s. Although China’s share has grown since then, this has been largely offset by the decline in Japan, whose share of output and exports has halved.
A renewed emphasis on exports by the US could be an outcome of the economic crisis and the Obama administration aspires to doubling US exports in 5 years. (See "Can Obama Really Double Exports in Five Years?".) This doubling figure of course also requires some unpacking. It would be more meaningful if it meant a doubling of exports in comparison to the rise of GDP rather than a simple doubling of the USD figure.

What about the financial sphere?
Asian stockmarkets account for 34% of global market capitalisation, ahead of both America (33%) and Europe (27%). Asian central banks also hold two-thirds of all foreign-exchange reserves. That sounds impressive, but their influence over global financial markets is more modest, because official reserves account for only around 5% of the world’s total stash of financial assets. The bulk of private-sector wealth still lies in the West. The fact that Asian currencies make up only 3% of total foreign-exchange reserves indicates how far Asia still lags in financial matters.
While there is no doubt that on a PPP basis Asia has been expanding enormously, it's important to remember that Asia's international transactions are mainly conducted in USD. Asia (once again especially China) consumes considerably less than Western countries.
What really matters to Western firms is consumer spending in plain dollar terms. Although over three-fifths of the world’s population live in Asia, they only account for just over one-fifth of global private consumption, much less than America’s 30% share. But official figures almost certainly understate consumer spending in emerging Asia, because of the poor statistical coverage of spending on services. Figures from the Economist Intelligence Unit, a sister company of The Economist, suggest that Asia accounts for around one-third of world retail sales. Asia is now the biggest market for many products, accounting for 35% of all car sales last year and 43% of mobile phones. Asia guzzles 35% of the world’s energy, up from 26% in 1995. It has accounted for two-thirds of the increase in world energy demand since 2000.
Many Western firms are more interested in Asia’s capital spending than its consumption, and here Asia is undoubtedly the giant. In 2009, 40% of global investment (at market exchange rates) took place in Asia, as much as in America and Europe combined. In finance, Asian firms launched eight of the ten biggest initial public offerings (IPOs) in 2009 and more than twice as much capital was raised through IPOs in China and Hong Kong last year as in America.
Finally, The Economist, contains a graphic illustrating just how far Asia fell from its historical position of dominance up until 1800.


This graph, however, provides a lesson that The Economist, perhaps did not intend. Despite its continuing dominance of the world economy until the early nineteenth century, from the mid sixteenth century Europe - led by Spain and Portugal, followed by Holland and England - is clearly in the ascendancy. Gross economic weight is clearly not everything.

Thursday, January 21, 2010

Stephen Roach on China

Stephen Roach's comments on Asia and China are always worth noting. See "It's not yet Asia's world: Stephen Roach"
Once again I agree with this piece's argument that the jury is still out on whether all is hunky dory. Because commentators often like to imagine that tendencies are already established realities, China's rise is already seen as total victory over the US and the West. There is still a long way to go as I argue in Chapter 3 of The Vulnerable Country.

Roach argues that recovery will be weak:
"Headwinds linger in the form of write-downs by financial institutions, the breadth of the global recession, and chronic weakness in the demand side of the world — the American consumer — and the persisting imbalances in the supply side of the world — Asia, and in particular in China." ... "there’s a lot of complacency here, presuming that the post-crisis world is Asia’s for the asking"

He is not, however, overly pessimistic (neither am I) he just thinks that it's a big assumption to think that China can be the engine of global growth. It's just not there yet.

The real danger is a prolonged period of stagnation (or worse) in the US and a failure of China to adjust its growth model towards higher wages and greater domestic consumption.

All of this, of course, will affect Australia greatly.

Monday, January 11, 2010

... but China just keeps on keeping on

While people like me keep wondering about the China story and it's future impact on Australia, it's important to note that it does keep on passing milestones. As the New York Times Reports.
China Becomes World’s No. 1 Exporter, Passing Germany
By THE ASSOCIATED PRESS

Published: January 10, 2010

BEIJING (AP) — China overtook Germany as the world’s top exporter after China’s December exports jumped 17.7 percent for their first increase in 14 months, data showed Sunday.
Exports for the last month of 2009 were $130.7 billion, data from the General Administration of Customs showed.
That raised total 2009 exports to $1.2 trillion, ahead of the 816 billion euros ($1.17 trillion) for Germany forecast by its foreign trade organization, BGA.
China’s new status is largely symbolic, but it reflects the ability of its resilient, low-cost manufacturers to keep selling abroad despite a slump in global consumer demand as a result of the financial crisis.
December’s rebound was an “important turning point” for exporters, a customs agency economist, Huang Guohua, said on the government television network CCTV.
“We can say that China’s export enterprises have completely emerged from their all-time low in exports.”
Stronger foreign sales of Chinese goods could help to drive the country’s recovery after demand plunged in 2008, forcing thousands of factories to close and throwing millions of laborers out of work.
Helped by a 4 trillion renminbi ($586 billion) stimulus package, China’s economic expansion accelerated to 8.9 percent for the third quarter of 2009.
The government says full-year growth should be 8.3 percent.
Economists and Germany’s national chamber of commerce said earlier that the country was likely to lose its longtime crown as top exporter.
China is best known as a supplier of shoes, toys, furniture and other low-tech goods, while Germany exports machinery and other higher-value products.
China surpassed the United States as the biggest auto market in 2009 and is on track to replace Japan as the world’s second-largest economy soon.
China passed Germany as the third-largest economy in 2007.
Even though China overtook Germany as top exporter, the customs agency said total 2009 Chinese trade fell 13.9 percent from 2008.