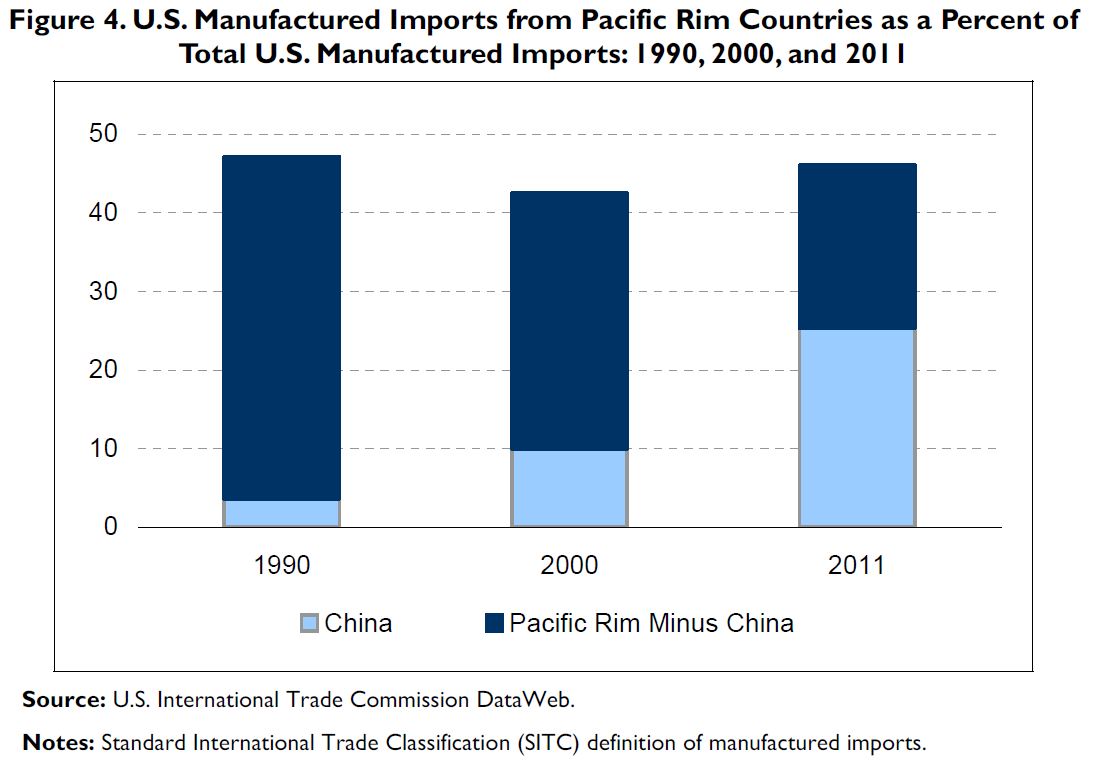
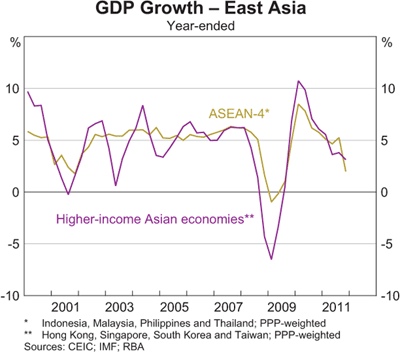
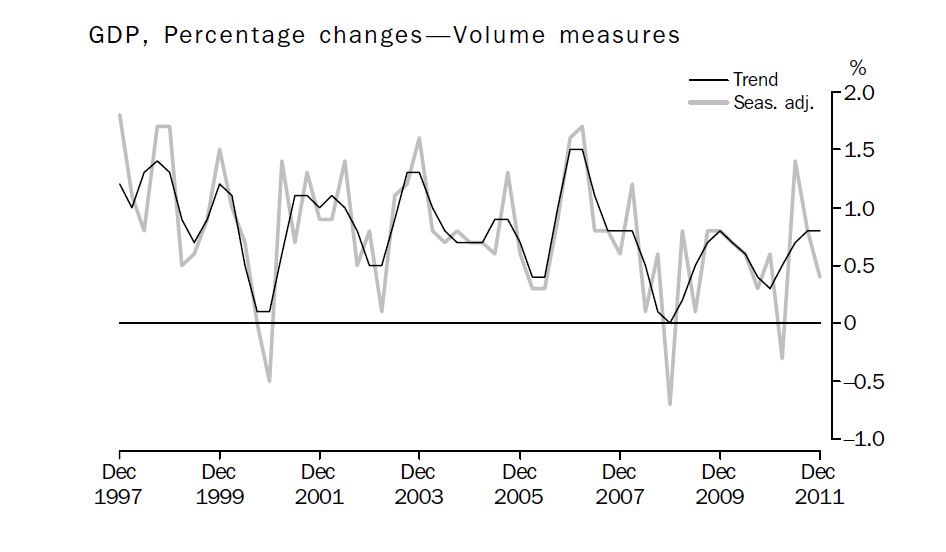
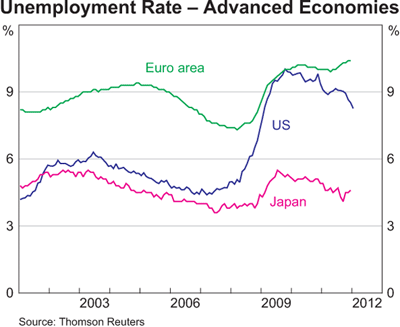
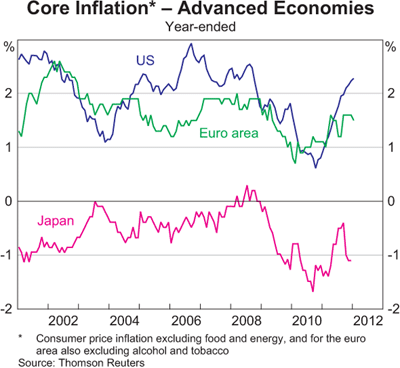
Asia's rise has been Australia's economic gain. The rise of Japan, followed by South Korea and Taiwan, Singapore, Malaysia, Thailand and other non-communist countries of Southeast Asia had provided significant export markets for Australian commodities, though not a sustained structural increase in their value. Then along came China, changing everything. Not only did rapid Chinese demand increase the prices Australia received for its exports, but also Chinese manufacturing production helped to decrease the price of Australian imports. Manufactured goods made (or assembled) in China became significantly cheaper. Chinese competitive pressures also helped to keep in check the prices manufacturers throughout the world could charge for their goods.
Currently there are several narratives about Australia’s economic future. The first is an acceptance of Australia’s role as a resource exporter built on the back of long-term Asian demand and a high exchange rate. Alongside this story is one about a growing Asian middle class, which will be increasingly receptive to utilising Australian services. This view means that there will be an alternative market for Australian exports after the Asian giants become less resource intensive economies as they progress up the income ladder.
All of these positive narratives are based on a projection that Asia's remarkable rise over the past half century will continue over the next half. The possibility that Asia may not continue its rapid economic rise is largely dismissed as a narrative, although the likelihood that Asia will become conflict-ridden is common in international relations, foreign policy and security studies.
To understand where Asia might be headed we need to fathom how far it has come since the end of World War II.
This post shows that if current GDP trends were to continue, even at a moderated pace, Asia will become the world's most important economic region and China the world's largest economy. Emerging market and developing economies have overtaken the advanced economies on a purchasing power parity basis. The major component of this GDP convergence has been the rise of developing Asia, particularly China. Asian GDP (both developed and developing) is now approaching the GDP of the European Union and the United States combined.
Economically, a continuation of present trends would provide amazing opportunities for Australia, although politically it might heighten concerns amongst Australians about the implications of Western and American relative decline.
Gregory Clark in A Farewell to Alms outlines the Malthusian world (from the Stone Age to 1800), which he argues exhibited “a counterintuitive logic” where:


In 1994, Paul Krugman compared the growth of the newly industrialising countries of Asia to Soviet growth in the 1950s and 1960s, a period when it appeared that the Soviets were on the brink of challenging the United States economically as well as militarily. He argued that ‘perspiration not inspiration’ had been the major factor. He saw Japan, however, as different:
Composed of 35 countries: Australia, Austria, Belgium, Canada, Cyprus, Czech Republic, Denmark, Estonia, Finland, France, Germany, Greece, Hong Kong SAR, Iceland, Ireland, Israel, Italy, Japan, Korea, Luxembourg, Malta, Netherlands, New Zealand, Norway, Portugal, San Marino, Singapore, Slovak Republic, Slovenia, Spain, Sweden, Switzerland, Taiwan Province of China, United Kingdom, and United States.
Major advanced economies (G7)
Composed of 7 countries: Canada, France, Germany, Italy, Japan, United Kingdom, and United States.
Other advanced economies (Advanced economies excluding G7 and euro area)
Composed of 14 countries: Australia, Czech Republic, Denmark, Hong Kong SAR, Iceland, Israel, Korea, New Zealand, Norway, San Marino, Singapore, Sweden, Switzerland, and Taiwan Province of China.
European Union
Composed of 27 countries: Austria, Belgium, Bulgaria, Cyprus, Czech Republic, Denmark, Estonia, Finland, France, Germany, Greece, Hungary, Ireland, Italy, Latvia, Lithuania, Luxembourg, Malta, Netherlands, Poland, Portugal, Slovak Republic, Slovenia, Spain, Sweden, Romania, and United Kingdom.
Emerging market and developing economies
Composed of 153 countries: Afghanistan, Albania, Algeria, Angola, Antigua and Barbuda, Argentina, Armenia, Azerbaijan, The Bahamas, Bahrain, Bangladesh, Barbados, Belarus, Belize, Benin, Bhutan, Bolivia, Bosnia and Herzegovina, Botswana, Brazil, Brunei Darussalam, Bulgaria, Burkina Faso, Burundi, Cambodia, Cameroon, Cape Verde, Central African Republic, Chad, Chile, China, Colombia, Comoros, Democratic Republic of the Congo, Republic of Congo, Costa Rica, Côte d'Ivoire, Croatia, Djibouti, Dominica, Dominican Republic, Ecuador, Egypt, El Salvador, Equatorial Guinea, Eritrea, Ethiopia, Fiji, Gabon, The Gambia, Georgia, Ghana, Grenada, Guatemala, Guinea, Guinea-Bissau, Guyana, Haiti, Honduras, Hungary, India, Indonesia, Iran, Iraq, Jamaica, Jordan, Kazakhstan, Kenya, Kiribati, Kosovo, Kuwait, Kyrgyz Republic, Lao P.D.R., Latvia, Lebanon, Lesotho, Liberia, Libya, Lithuania, FYR Macedonia, Madagascar, Malawi, Malaysia, Maldives, Mali, Marshall Islands, Mauritania, Mauritius, Mexico, Micronesia, Moldova, Mongolia, Montenegro, Morocco, Mozambique, Myanmar, Namibia, Nepal, Nicaragua, Niger, Nigeria, Oman, Pakistan, Panama, Papua New Guinea, Paraguay, Peru, Philippines, Poland, Qatar, Romania, Russia, Rwanda, Samoa, São Tomé and Príncipe, Saudi Arabia, Senegal, Serbia, Seychelles, Sierra Leone, Solomon Islands, South Africa, South Sudan, Sri Lanka, St. Kitts and Nevis, St. Lucia, St. Vincent and the Grenadines, Sudan, Suriname, Swaziland, Syria, Tajikistan, Tanzania, Thailand, Timor-Leste, Togo, Tonga, Trinidad and Tobago, Tunisia, Turkey, Turkmenistan, Tuvalu, Uganda, Ukraine, United Arab Emirates, Uruguay, Uzbekistan, Vanuatu, Venezuela, Vietnam, Yemen, Zambia, and Zimbabwe.
Developing Asia
Composed of 28 countries: Bangladesh, Bhutan, Brunei Darussalam, Cambodia, China, Fiji, India, Indonesia, Kiribati, Lao P.D.R., Malaysia, Maldives, Marshall Islands, Micronesia, Mongolia, Myanmar, Nepal, Papua New Guinea, Philippines, Samoa, Solomon Islands, Sri Lanka, Thailand, Timor-Leste, Tonga, Tuvalu, Vanuatu, and Vietnam.
ASEAN-5
Composed of 5 countries: Indonesia, Malaysia, Philippines, Thailand, and Vietnam.
Currently there are several narratives about Australia’s economic future. The first is an acceptance of Australia’s role as a resource exporter built on the back of long-term Asian demand and a high exchange rate. Alongside this story is one about a growing Asian middle class, which will be increasingly receptive to utilising Australian services. This view means that there will be an alternative market for Australian exports after the Asian giants become less resource intensive economies as they progress up the income ladder.
All of these positive narratives are based on a projection that Asia's remarkable rise over the past half century will continue over the next half. The possibility that Asia may not continue its rapid economic rise is largely dismissed as a narrative, although the likelihood that Asia will become conflict-ridden is common in international relations, foreign policy and security studies.
To understand where Asia might be headed we need to fathom how far it has come since the end of World War II.
This post shows that if current GDP trends were to continue, even at a moderated pace, Asia will become the world's most important economic region and China the world's largest economy. Emerging market and developing economies have overtaken the advanced economies on a purchasing power parity basis. The major component of this GDP convergence has been the rise of developing Asia, particularly China. Asian GDP (both developed and developing) is now approaching the GDP of the European Union and the United States combined.
Economically, a continuation of present trends would provide amazing opportunities for Australia, although politically it might heighten concerns amongst Australians about the implications of Western and American relative decline.
The Great (Re)convergence
The rise of developing Asia has been a major component of the so-called rise of the rest, which has led to the reversal of the great divergence between the advanced and developing economies that began with the industrial revolution. The great convergence is profoundly reshaping the world economy. Given that the world economy on the eve of the industrial revolution was dominated by Asia - particularly China and India we should perhaps consider the current period as the great reconvergence.Gregory Clark in A Farewell to Alms outlines the Malthusian world (from the Stone Age to 1800), which he argues exhibited “a counterintuitive logic” where:
anything that raised the death rate schedule –war, disorder, disease, poor sanitary practices, or abandoning breast feeding – increased material living standards. Anything that reduced the death rate schedule – advances in medical technology, better personal hygiene, improved public sanitation, public provision for harvest failures, peace and order – reduced material living standards.In other words, vice equalled virtue and virtue equalled vice. Even gradual improvements in technology increased population and therefore did not lead to lasting increases in living standards. Hobbes, Clark contends, was wrong; man was better off in his natural state.
The Industrial Revolution, whose most remarkable feature is the “all-pervading rise in incomes per person”, changed all that and led to a remarkable divergence between rich and poor countries. The gap between the living standards of the rich and poor countries grew from 3-4:1 before 1800 to 40-50:1 in the late twentieth century.
World Economic History
Source: Clark
The commercial revolution from the late fifteenth century shows that global economic weight is not necessarily an indication of global power. Asia's dominance of the world economy until the early nineteenth century could not stop it from being overrun by European colonial powers from the sixteenth century. Economic dominance was overcome by military superiority.
Gross economic weight is clearly not everything, but there can be no doubt that economic relativities are changing, which provides the possibility that the West's period of dominance is coming to an end.
Growth in Asia since the 1960s has been nothing short of remarkable. Economic success, however, was far from universal. Until the late 1980s, authoritarian capitalist states and authoritarian communist states divided Asia. Countries under US tutelage embraced an authoritarian form of capitalism with a strong developmental ethos. The success of capitalist economic development provided a stark contrast to the failures of the socialist centrally planned development model.
China attempted to collectivise and control economic development from the centre, Vietnam struggled with war and its aftermath, and India fostered autarkic import substitution policies that led to stunted growth. Even before the end of the Cold War, the Communist and insular states realised that shifts in economic direction were vital if they were going to replicate the high growth rates of capitalist Asia. China began its long march to capitalist dynamism in 1978 and Vietnam switched economic direction in the mid-1980s.
By the early 1990s, Japan appeared to be set to overtake the US economy, but unfortunately the 1990s were a decade of stagnation after the excessive property and stock market boom of the late 1980s. In the late 1990s, the region suffered a severe financial crisis which threatened to derail Asia’s rise, but by the early 2000s it was clear that the crisis was only a temporary set back on Asia’s phenomenal economic rise.
From the mid-1990s, China became the major economic story in the region because of its sustained high growth rates. China's continuing growth during the economic crisis that began in 2007 cemented Asia's place as the centre of world economic dynamism. Growing regional production networks initially developed by Japan in the 1980s, followed by South Korea, Taiwan, Singapore and Hong Kong and now centred on the Chinese economy have reinforced Asian dynamism. Despite assertions about decoupling, final goods demand from outside the region still matters for Asian growth.
In recent years, many analysts have argued that India will join China as a major Asian success story. Developing Asia has been joined by other emerging economies to transform the world economy since the 1980s. The countries of Eastern Europe, Brazil and South Africa have led to the great reconvergence.
Emerging market and developing economies now account for over 50 per cent of the world economy on a PPP basis, surpassing the total weight of the developed economies. This is a remarkable change from 1990 when the emerging market and developing countries accounted for a little over 30 per cent. Since 1990 emerging and developing economies have been on an ever-upward trajectory, with the global crisis beginning in 2007 thus far affecting mainly the United States and Europe.


Comparing the top 5 plus the EU we can clearly see the significant changes to relative weights since the early 1990s. These trends have been strengthened since the global crisis. The advanced capitalist countries have lost ground to China and India.

All Graphs
Gross Domestic Product (Purchasing-Power-Parity)
Share of World Total
Percent
Share of World Total
Percent
Source: IMF World Economic Outlook (see here for definitions of country groups)
The bulk of the increase in the emerging and developing country share has been accounted for by developing Asian economies, particularly China.
The Asian economies combined - both developed and developing - are approaching the economic weight of the European Union and United States combined. Given projected relative growth rates Asia should overtake the EU and US in the near future. The EU and the US combined has declined from 55.8 per cent of the total in 1980 to 37.4 per cent in 2013.
The rising economic weight of Asia has mainly been a result of rapid growth in China, although India and the ASEAN 5 have also contributed. China's increased weight has been at the expense of Japan. (Developed Asia includes Japan, South Korea, Singapore, Taiwan and Hong Kong)
Comparing the top 5 plus the EU we can clearly see the significant changes to relative weights since the early 1990s. These trends have been strengthened since the global crisis. The advanced capitalist countries have lost ground to China and India.
The Future
Ideas about an Asian ascendancy are not new. US President, Theodore Roosevelt, writing in 1903 argued that: “The Atlantic era is now at the height of its development and must soon exhaust the resources at its command. The Pacific era, destined to be the greatest of all, is just at its dawn.” (Yahuda) War and the dilemmas of decolonisation made Roosevelt’s prediction premature, but the post-war world has seen Asia rise to the world’s most dynamic economic region. The general assumption today is that the Asian ascendancy will continue, even if the breakneck speed of growth moderates in coming years.In 1994, Paul Krugman compared the growth of the newly industrialising countries of Asia to Soviet growth in the 1950s and 1960s, a period when it appeared that the Soviets were on the brink of challenging the United States economically as well as militarily. He argued that ‘perspiration not inspiration’ had been the major factor. He saw Japan, however, as different:
Japan, unlike the East Asian “tigers”, seems to have grown both through high rates of input growth and through high rates of efficiency growth. Today’s fast-growth economies are nowhere near converging on US efficiency levels, but Japan is staging an unmistakable technological catch-up.
Krugman argued that while Japan was experiencing an unmistakable ‘growth slowdown’, he underestimated the extent to which Japan would stagnate over the rest of the 1990s and early 2000s. If Japan had continued to grow at the rates achieved over the period, 1963–73, he predicted it would have overtaken ‘the United States in real per capita income by 1985, and total Japanese output would have exceeded that of the United States by 1998!’. Krugman also noted the differences of the Chinese growth story to that of the Asian tigers. Significantly, he pointed out that, ‘its population is so huge that it will become a major economic power if it achieves even a fraction of Western productivity levels’. By the early 1990s, it was clear that China’s shift in direction was leading to rapid and sustained economic growth.
The Japanese story should at least alert us to the dangers of the belief that the recent past and the present provide clear guides to the future. While the Asian challenge to Western dominance will probably be the issue of the twenty-first century, we should be wary of substituting a possible future for the present. Asia still has a long way to go and many hurdles to negotiate before its global economic influence matches its growing economic weight.
The contemporary structure of the world 'political' economy has been shaped by the advanced economies, particularly the United States. This liberal economic order has 'allowed' the rise of developing countries, who are now demanding a larger say in global economic institutions such as the World Trade Organisation.
But domestic political developments could be just as important. Over the next generation, how the advanced countries deal with challenges to their economic supremacy and counter the negative domestic consequences of globalisation will shape the future trajectory of the world political economy.
Protectionist responses to relative decline and growing inequality in developed economies would be damaging in an integrated and thus interdependent world economy.Global and regional production structures would exacerbate the impact of protectionist responses, although their existence could also make any shifts toward protectionism more costly and therefore less likely. Whatever the case, the ability of the developed world to influence structure remains paramount. An ironic, if unlikely, turn away from globalisation in the advanced economies would negatively affect export-oriented economies disproportionately.
Asia's ability to avoid conflict.will also be paramount for a continuation of current trends. Asia’s current situation is unprecedented. Three major powers – China, Japan and India, together with the United States – will shape the future of the region. Australia has alliances with two of the powers, is an important contributor to China's economic rise and has much to offer India as well. Australia stands to benefit greatly from continued economic expansion in Asia and to lose enormously if economic crisis, political instability or environmental catastrophe override economic development.
Australia has a role to play in helping to establish the regional institutions and diplomatic environment for peaceful relationships. Bilateral relationships will also be very important. But much of the action will take place regardless of our wishes. Australia needs to prepare for the possibility of conflict and economic downturn, while working and hoping for the best. If peaceful development continues, Australia will be fortunate to be geographically adjacent to the world’s most dynamic economic region. Australia’s prosperity is now dependent on continuing Asian economic growth. What happens in Europe and North America still matters for Australia, but nothing matters to us more than Asia.
Notes
IMF definitions
Advanced economiesComposed of 35 countries: Australia, Austria, Belgium, Canada, Cyprus, Czech Republic, Denmark, Estonia, Finland, France, Germany, Greece, Hong Kong SAR, Iceland, Ireland, Israel, Italy, Japan, Korea, Luxembourg, Malta, Netherlands, New Zealand, Norway, Portugal, San Marino, Singapore, Slovak Republic, Slovenia, Spain, Sweden, Switzerland, Taiwan Province of China, United Kingdom, and United States.
Major advanced economies (G7)
Composed of 7 countries: Canada, France, Germany, Italy, Japan, United Kingdom, and United States.
Other advanced economies (Advanced economies excluding G7 and euro area)
Composed of 14 countries: Australia, Czech Republic, Denmark, Hong Kong SAR, Iceland, Israel, Korea, New Zealand, Norway, San Marino, Singapore, Sweden, Switzerland, and Taiwan Province of China.
European Union
Composed of 27 countries: Austria, Belgium, Bulgaria, Cyprus, Czech Republic, Denmark, Estonia, Finland, France, Germany, Greece, Hungary, Ireland, Italy, Latvia, Lithuania, Luxembourg, Malta, Netherlands, Poland, Portugal, Slovak Republic, Slovenia, Spain, Sweden, Romania, and United Kingdom.
Emerging market and developing economies
Composed of 153 countries: Afghanistan, Albania, Algeria, Angola, Antigua and Barbuda, Argentina, Armenia, Azerbaijan, The Bahamas, Bahrain, Bangladesh, Barbados, Belarus, Belize, Benin, Bhutan, Bolivia, Bosnia and Herzegovina, Botswana, Brazil, Brunei Darussalam, Bulgaria, Burkina Faso, Burundi, Cambodia, Cameroon, Cape Verde, Central African Republic, Chad, Chile, China, Colombia, Comoros, Democratic Republic of the Congo, Republic of Congo, Costa Rica, Côte d'Ivoire, Croatia, Djibouti, Dominica, Dominican Republic, Ecuador, Egypt, El Salvador, Equatorial Guinea, Eritrea, Ethiopia, Fiji, Gabon, The Gambia, Georgia, Ghana, Grenada, Guatemala, Guinea, Guinea-Bissau, Guyana, Haiti, Honduras, Hungary, India, Indonesia, Iran, Iraq, Jamaica, Jordan, Kazakhstan, Kenya, Kiribati, Kosovo, Kuwait, Kyrgyz Republic, Lao P.D.R., Latvia, Lebanon, Lesotho, Liberia, Libya, Lithuania, FYR Macedonia, Madagascar, Malawi, Malaysia, Maldives, Mali, Marshall Islands, Mauritania, Mauritius, Mexico, Micronesia, Moldova, Mongolia, Montenegro, Morocco, Mozambique, Myanmar, Namibia, Nepal, Nicaragua, Niger, Nigeria, Oman, Pakistan, Panama, Papua New Guinea, Paraguay, Peru, Philippines, Poland, Qatar, Romania, Russia, Rwanda, Samoa, São Tomé and Príncipe, Saudi Arabia, Senegal, Serbia, Seychelles, Sierra Leone, Solomon Islands, South Africa, South Sudan, Sri Lanka, St. Kitts and Nevis, St. Lucia, St. Vincent and the Grenadines, Sudan, Suriname, Swaziland, Syria, Tajikistan, Tanzania, Thailand, Timor-Leste, Togo, Tonga, Trinidad and Tobago, Tunisia, Turkey, Turkmenistan, Tuvalu, Uganda, Ukraine, United Arab Emirates, Uruguay, Uzbekistan, Vanuatu, Venezuela, Vietnam, Yemen, Zambia, and Zimbabwe.
Composed of 28 countries: Bangladesh, Bhutan, Brunei Darussalam, Cambodia, China, Fiji, India, Indonesia, Kiribati, Lao P.D.R., Malaysia, Maldives, Marshall Islands, Micronesia, Mongolia, Myanmar, Nepal, Papua New Guinea, Philippines, Samoa, Solomon Islands, Sri Lanka, Thailand, Timor-Leste, Tonga, Tuvalu, Vanuatu, and Vietnam.
ASEAN-5
Composed of 5 countries: Indonesia, Malaysia, Philippines, Thailand, and Vietnam.
My definition of Total Asia includes Developing Asia plus Japan, Korea, Taiwan, Hong Kong and Singapore.