The economic relationship between the United States is one of the world's most important. The trade balance is considerably in China's favour and is matched by huge Chinese purchases of US debt securities. Although it has grown significantly in recent years, Chinese foreign direct investment (FDI) in the United States is still negligible at considerably less than one percent and US FDI in China constitutes about 10 per cent of the total.
While it is
true that US-China trade as a percentage of China's total trade has been in decline over recent years, the United States and Europe (i.e. most of the developed market economies) remain key elements of final demand for products exported from China, but often sourced from other countries in Asia and from the United States itself.
The Trade Relationship
The trade relationship is marked by tensions as
politicians in the United States seek to blame China for US economic woes. A Romney ad states: "It’s time to stand up to the cheaters and make sure we protect jobs for the American people." Meanwhile an Obama ad responds: "Romney’s companies were called pioneers in shipping U.S. manufacturing jobs overseas. He invested in firms that specialized in relocating jobs to low-wage countries like China. Even today part of Romney’s fortune is invested in China. Romney’s never stood up to China. All he’s done is send them our jobs."
Mutual suspicions about security issues increase the potential for economic conflict. But generally candidates are more critical during election campaigns, downplaying the rhetoric and action when in office.
US merchandise trade with China have grown markedly in importance since 1980 as the table below makes clear. [trade figures are generally divided into merchandise and services trade and services trade figures are often not included even though this is often unstated.]
The United States and China trades reestablished diplomatic relations and signed a bilateral trade agreement 1979, while
most-favored-nation (MFN) status was granted in 1980.
In 2011 merchandise exports to China increased to $103.9 billion, up 13.1% over 2010 levels. China is now the United States' 3rd most important export market, replacing Japan after 2007.
According to
Morrison
From 2000 to 2011, the share of total U.S. exports going to China rose from 2.1% to 7.0%. The top five merchandise U.S. exports to China in 2011 were waste and scrap, oilseeds and grains, aircraft and parts, semiconductors and other electronic components, and motor vehicles China is also a significant market for U.S. exports of private services, which totaled $21.1 billion in 2010 (the most recent year available), which was a 35.3% increase over 2009 levels, making China the seventh-largest export market for U.S. private services.
This means, according to the US-China Business Council (from Morrison) that the "total market for the sale of U.S. goods and services in China (i.e., U.S. exports and sales by U.S.-invested firms in China) could be as high as $200 billion annually." [For up-to-date statistics see the US Census Bureau
Stats on Foreign Trade].
The
Office for the United States Trade Representative reports that:
U.S. goods and services trade with China totaled $539 billion in 2011. Exports totaled $129 billion; Imports totaled $411 billion. The U.S. goods and services trade deficit with China was $282 billion in 2011. China is currently our 2nd largest goods trading partner with $503 billion in total (two ways) goods trade during 2011. Goods exports totaled $104 billion; Goods imports totaled $399 billion. The U.S. goods trade deficit with China was $295 billion in 2011. Trade in services with China (exports and imports) totaled $36 billion in 2011 (preliminary data). Services exports were $25 billion; Services imports were $11 billion. The U.S. services trade surplus with China was $13 billion in 2011.
While US exports to China have slowed in recent years in comparison to US trade with the rest of the world over the 10 years
from 2002-2011 "U.S. exports to China increased by about 471% (the overall growth in U.S. exports over this period was 213.6%)."
According to the
US-China Business Council, the United States was China's biggest trading partner and export market and the 4th biggest import source in 2010.
However, while China is only the third largest export market for the United States, the US deficit with China is by far and away its biggest deficit.
This headline figure fuels the ire of American protectionists, but masks the extent to which China's 'exports' are re-exports from elsewhere. The iPhone provides a neat illustration of this distortion. According to
Yuqing Xing
Using the total manufacturing cost $178.96 as the price of the iPhone, China’s iPhone exports to the US amounted $2.0 billion in 2009. Assuming that the parts supplied by Broadcom, Numonyx and Cirrus Logic, valued at $121.5 million, were imported from the US the iPhone alone contributed $1.9 billion trade deficit to the US, about 0.8% of the US trade deficit with China ...
But
most of the export value and the deficit due to the iPhone are attributed to imported parts and components from the third countries and have nothing to do with China. Chinese workers simply put all these parts and components together and contributed only $6.50 to each iPhone, about 3.6% of the total manufacturing cost (e.g. the shipping price). The traditional way of measuring trade credits all $178.98 to China when an iPhone is shipped to the US, thus exaggerating the export volume as well as the imbalance. Decomposing the value added along the value chain of the iPhone manufacturing suggest that, of the $2.0 billion iPhone export from China, 96.4% is actually the transfer from Germany ($326 million), Japan ($670 million), Korea ($259 million), the US ($108 million) and others ($542 million). All of these countries are involved in the iPhone production chain.
If China’s iPhone exports were calculated based on the value added, i.e., the assembling cost, the export value as well as the trade deficit in the iPhone would be much smaller, at only $73 million, just 3.6% of the $2.0 billion calculated with the prevailing method.
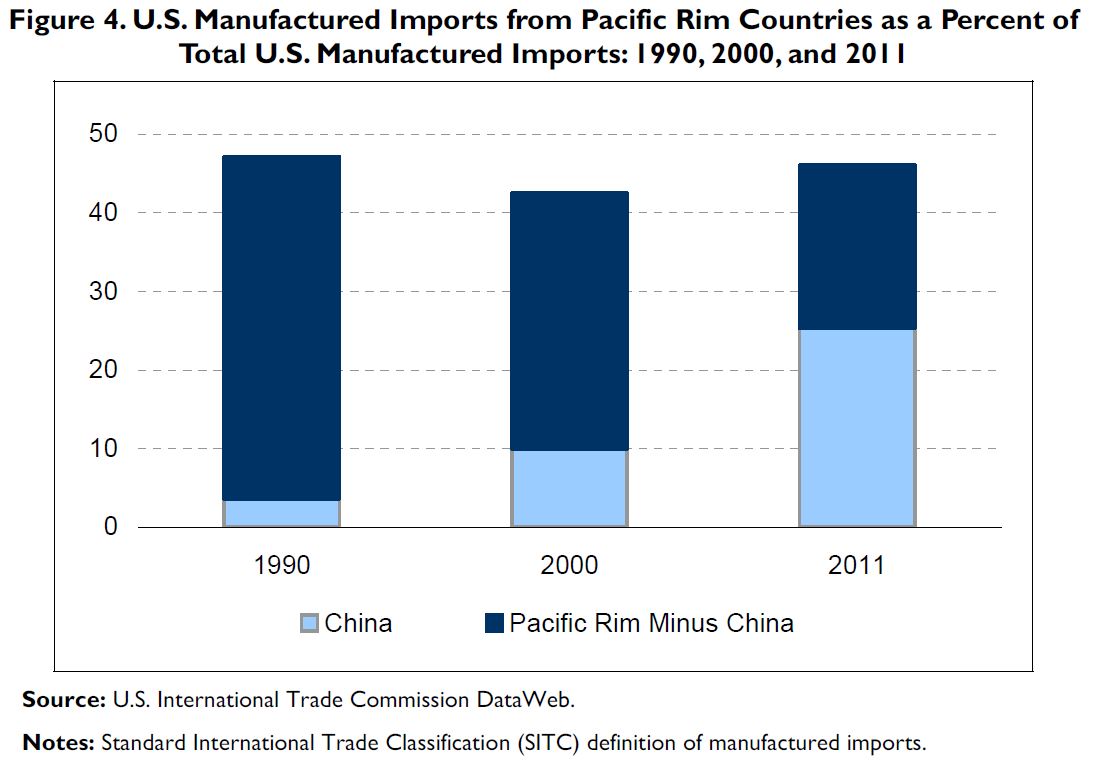
Morrison also points out that US trade with China has mainly replaced trade with other Pacific Rim countries. [Pacific Rim countries include Australia, Brunei, Cambodia, China, Hong Kong, Indonesia, Japan, South Korea, Laos, Macao, Malaysia, New Zealand, North Korea, Papua New Guinea, the Philippines, Singapore, Taiwan, Thailand, Vietnam, and several small island nations.] In terms of manufactured imports in 1990 47.1% of the value came from Pacific Rim countries (including China), while in 2011 the same countries accounted for 46.1% of the total. US manufactured imports from China increased from 3.6% to 25.3% over the same period!
While the US-China trade relationship is an important component of each country's trade, the US does not have as much to lose as other countries if Chinese growth slows. Chinese imports make a significant contribution to growth of a wide range of countries, including Australia.
According to
Mackenzie "0.6 percentage points of Germany’s 3 per cent GDP growth for 2011 — or, about a fifth — was courtesy of its exports to China ... There’s a certain irony here in that Germany is simultaneously importing less from some eurozone peripherals, to a degree that could be harming their prospects of recovery." For the United States "Chinese imports also contributed to 0.1 percentage points" of 1.7 per cent GDP growth in 2011, which while appearing like an insignificant number is actually "almost 6 per cent of US GDP growth."
When considered in terms of share of total exports, Australia is the second most Chinese-dependent economy in the world. And as I've argued before, the negative impact on Australia of a growth slowdown in China will be felt indirectly as well through the impact on our second and third largest export destinations Japan and Korea. (China accounted for 24.6%, Japan 16.7% and Korea for 8.0% of
total exports in 2011)
Similar to Australia, US policy-makers and business people see great potential for future trade with China as it becomes richer and as a growing middle class demands more advanced goods and services. Morrison cites a 2009 Boston Consulting Group report arguing that "China had 148 million 'middle class and affluent' consumers, defined as those whose annual household income was 60,000 RMB ($9,160) or higher, and that level is projected to rise to 415 million by 2020."
Although Chinese private consumption as a percent of GDP is much lower than that of most other major economies, the rate of growth of Chinese private consumption has been rising rapidly. For example, private consumption as a percent of GDP in China in 2011 was 34.0%, compared to 71.1% in the United States. However, the annual rate of growth in Chinese private consumption from 2002 to 2011 averaged 8.0%, while the U.S. annual average was 1.9%.
The Investment Relationship
The investment relationship is also very significant for both countries and the wider world. A majority of Chinese investment in the United States is in public and private securities (including, according to Morrison, U.S.Treasury securities, U.S. government agency (such as Freddie Mac and Fannie Mae) securities,
corporate securities, and equities (such as stocks)."
U.S. Treasury securities "are the largest category of U.S. securities held by China". Most US investment in China is foreign direct investment (investment of greater than 10 per cent in a company).
China's holdings of Treasuries "increased from $118 billion in 2002 to $1.15 trillion in 2011", although holdings declined by 0.7% in 2011. China replaced Japan as the largest holder of Treasury securities in 2008.
There is considerable debate about whether this ownership of treasuries gives China influence over China or whether it signals a so-called
balance of financial terror. I've written before about these claims
here and
here, based on the work of Michael Pettis. To summarise, such claims are overblown. As Pettis points out:
As long as China maintains its own currency and denominates all domestic transactions in RMB, the PBoC reserves cannot be used in China. They cannot go to pay doctors’ salaries, to build bridges, to lower taxes or to subsidize consumption. They can only be used to purchase or pay for things from outside China. This means that reserves ensure that China can import foreign commodities and other goods as long as it can pay for them domestically. It also means that the PBoC can ensure the availability of dollars to repay foreign debt and foreign investment. ...
The US government does not need foreign buyers for its bonds. On the contrary, it is in Washington’s best interest that foreign central banks sharply reduce their purchases of USG bonds.
According to
Murray and Labonte foreigners owned 56.9% of federal govt debt at the end of 2011, up from 53.5% at the end of 2007.
China holds the largest percentage with 23.1 per cent, followed by Japan with 21.2 per cent. The Luxembourg and Caribbean Banking centres are probably fronts for Middle Eastern buyers and Hedge Funds and in the past China has bought Treasuries through companies operating out of London.
Compared to the amount of foreign investment in securities FDI between the two countries is very small.
The Office of the United States Trade Representative reports that:
U.S. foreign direct investment (FDI) in China (stock) was $60.5 billion in 2010 (latest data available), a 21.4% increase from 2009. U.S. direct investment in China is led by the manufacturing and banking sectors. China FDI in the United States (stock) was $3.2 billion in 2010 (latest data available), up 171.6% from 2009. China direct investment in the U.S. is led by the wholesale trade sector.
The total stock of FDI in the US in 2010 according to UNCTAD's 2012
World Investment Report was $3,397 billion, which means that the stock of Chinese FDI in the United States as a percentage of the whole was 0.09%.
According to Morrison, the Bureau of Economic Affairs (the US equivalent to the ABS) adds FDI
from China and
for China through offshore centres such as Hong Kong and designates this calculation the “ultimate beneficial owner” (UBO) of FDI. This increases the amount of "China’s cumulative FDI flows to the United States through 2010 by 86% to $5.8 billion."
If we use this enhanced figure it means that China's percentage of total FDI was 0.17% in 2010.
Even this UBO figure "would rank China as the
30th-largest source of total FDI in the United States through 2010.
The Rhodium Group (a private research consultancy and advisory company) estimates cumulative Chinese FDI flows to the United States through the end of 2010 at $11.7 billion and that the amount of new Chinese FDI in the United States in 2010 was $5.2 billion.
Accepting this higher figure would mean that, like Australia, recent increases in Chinese FDI in the United States are significant but from a very low base. To put the US figure in context, the total stock of Chinese FDI in Australia at the end of 2011 was AUD13.3 billion.
US FDI in China ($60.5) billion as a percentage of the total stock in 2010 ($587.8 billion) was 10.3% of the total.
Conclusion
There is no doubt that Asia has outperformed the rest of the world over recent years. But the pertinent question to ask is whether it can continue to perform well if growth stays anaemic in Europe (the world's most important economic region), the United States (the world's largest economy) and Japan (the world's third largest economy). As Michael Pettis argues in his latest newsletter, what the world needs form China at the moment is not more growth, but more net demand.
A rebalancing Chinese economy that grows at a slower rate but a shift in wealth towards households will be good for the United States, but perhaps bad for Australia.