This from the US-China Business Council ... Well worth a read to break down a few myths about US-China relations.
Firstly, US exports to China have grown at a far greater rate than US exports to the rest of the world.

The next biggest growth market is Brazil, which has grown at 180% compared to 542%.

Not surprisingly Canada is a far more important export market for the US, followed by Mexico. See geography does still matter, despite the guff written about the "end of geography" in the 1980s.


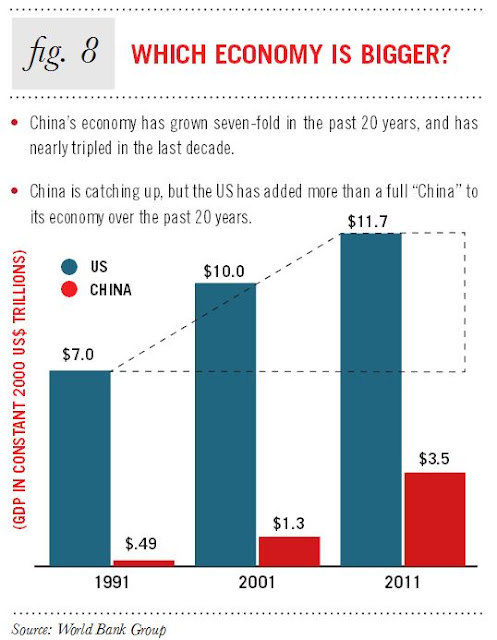
To prove its point about the continuing domination of the US economy, the authors use the USD exchange rate measure of economic weight. As I argue in How Big, How Rich and How Developed? The State of Play in the World Economy:

One should be very cautious about this projection, which seems to animate Australian policy-makers as well. It could turn out to be true, but before 2020 China is likely to suffer a big slowdown in growth, which might make these "middle class" growth projections come unstuck.

This is the one that would surprise most people. Although value-added measured via purchasing power parity would show a significantly different result I would think. Other analysts argue that the Chinese manufacturing sector surpassed the US manufacturing sector in terms of value-added late last decade. Remember too that value-added is just one way to measure the size of the sector (although it is perhaps the most important measure). China does a good deal of assembling still, but as wages increase these assembling operations will increasingly shift to elsewhere in Asia and perhaps Latin America.


Chinese foreign direct investment (non-bond investment) in the US has grown rapidly in recent years, but to put the level of Chinese FDI in the US into context, it is roughly the same as Chinese FDI in Australia.

 As The Heritage Foundation reports: "The leading recipients of Chinese non-bond investment since 2005 have
been Australia and the U.S. Other major recipients are Canada, Brazil,
Britain, and Indonesia. In 2012 alone, Canada topped the list, thanks to
the Chinese CNOOC's $15.1 billion acquisition of Nexen, the largest
outbound investment to date. The U.S. was second: After a weak 2011,
Chinese investment here shattered the old annual record with over $14
billion spent (including a $4.2 billion acquisition late in the year).
North America drew a full 40 percent of Chinese non-bond investment in
2012."

Perhaps the most controversial and widely misunderstood aspect of the US-China economic relationship is the issue of Chinese purchases of US Treasury securities, with many commentators arguing that it represents a Chinese advantage over the US. As Hillary Clinton said: "How do you deal toughly with your banker?" Fortunately for the US, this 'problem' is overblown. Indeed, reduced Chinese purchases of US Treasury securities would be good, rather than bad, for the US. As the graphic makes clear most Treasuries are held by Americans anyway. For an explanation of China's Reserves see here and here.


Firstly, US exports to China have grown at a far greater rate than US exports to the rest of the world.


Not surprisingly Canada is a far more important export market for the US, followed by Mexico. See geography does still matter, despite the guff written about the "end of geography" in the 1980s.


To prove its point about the continuing domination of the US economy, the authors use the USD exchange rate measure of economic weight. As I argue in How Big, How Rich and How Developed? The State of Play in the World Economy:
How we measure economies matters. To get a clearer picture of the world economy we need to look not only at size, but wealth, development and distribution. But even when measuring the size and wealth of economies, the method of measurement we choose will have a big impact on the outcome. ...
There are two ways to measure the size of economies. Firstly, we can convert the value of a country's gross domestic product (GDP) into US dollars and compare it to the GDP of other countries whose currencies have been converted into US Dollars also. ... When exchange rates do vary considerably over time, such as the dollar–yen exchange rate after the 1970s, this method may cause distorted measures of size. ...
Such discrepancies have led to the increased use of an alternative method of measuring the size of economies based on the concept of purchasing power parity (PPP). Statisticians measure purchasing power within individual economies and then make comparisons on that basis. PPP measures GDP adjusted to reflect different costs of living and production within different economies. As most travellers know, goods and services and production costs are considerably lower in some countries than they are in others.


One should be very cautious about this projection, which seems to animate Australian policy-makers as well. It could turn out to be true, but before 2020 China is likely to suffer a big slowdown in growth, which might make these "middle class" growth projections come unstuck.

This is the one that would surprise most people. Although value-added measured via purchasing power parity would show a significantly different result I would think. Other analysts argue that the Chinese manufacturing sector surpassed the US manufacturing sector in terms of value-added late last decade. Remember too that value-added is just one way to measure the size of the sector (although it is perhaps the most important measure). China does a good deal of assembling still, but as wages increase these assembling operations will increasingly shift to elsewhere in Asia and perhaps Latin America.

Given the still very large US manufacturing sector it is not surprising that US companies' manufacturing assets are located mainly in the US itself.

Chinese foreign direct investment (non-bond investment) in the US has grown rapidly in recent years, but to put the level of Chinese FDI in the US into context, it is roughly the same as Chinese FDI in Australia.
 As The Heritage Foundation reports: "The leading recipients of Chinese non-bond investment since 2005 have
been Australia and the U.S. Other major recipients are Canada, Brazil,
Britain, and Indonesia. In 2012 alone, Canada topped the list, thanks to
the Chinese CNOOC's $15.1 billion acquisition of Nexen, the largest
outbound investment to date. The U.S. was second: After a weak 2011,
Chinese investment here shattered the old annual record with over $14
billion spent (including a $4.2 billion acquisition late in the year).
North America drew a full 40 percent of Chinese non-bond investment in
2012."

Perhaps the most controversial and widely misunderstood aspect of the US-China economic relationship is the issue of Chinese purchases of US Treasury securities, with many commentators arguing that it represents a Chinese advantage over the US. As Hillary Clinton said: "How do you deal toughly with your banker?" Fortunately for the US, this 'problem' is overblown. Indeed, reduced Chinese purchases of US Treasury securities would be good, rather than bad, for the US. As the graphic makes clear most Treasuries are held by Americans anyway. For an explanation of China's Reserves see here and here.


