Friday, May 4, 2012

Some More Figures on Commodity Prices

In its May 2012 Statement on Monetary Policy, the RBA included this graph on the price declines of individual commodities.


The analysis of recent developments is less gloomy, although the year-on-year declines are considerable.
The [commodity price] index remains at a historically high level, but is around 9 per cent lower than its peak in mid 2011. In general, commodity prices have been supported by the gradual pick-up in global economic activity since the start of the year, though increases in some prices have been partially retraced over April. Spot prices for iron ore and base metals have all increased, while spot prices for both thermal and coking coal have declined in recent months, largely reflecting increased supply. Australia’s terms of trade are estimated to have declined further in the March quarter, as average export prices for bulk commodities continue to decline gradually from their September 2011 peak.

 What happens to prices will largely depend on Chinese demand and the prognosis on that is generally not a confident one by most commentators.

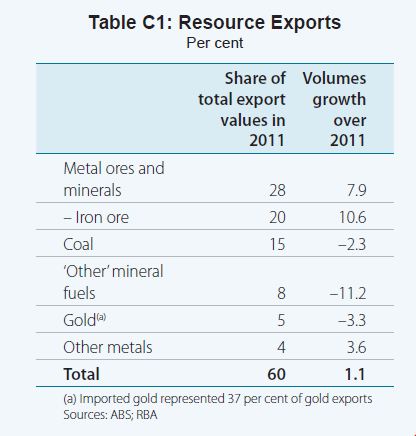
The RBA discusses Australia's resource exports. In relation to iron ore, the depth of Australia's dependence on China is revealed:
Iron ore is Australia’s most significant export, accounting for around 20 per cent of total export values in 2011. The primary destination of Australia’s iron ore exports is China, which accounted for around 70 per cent of iron ore export volumes in 2011, while Japan and Korea imported most of the remaining 30 per cent. Iron ore volumes grew by 10½ per cent over 2011, which is slightly slower than the average annual pace of growth over the past decade. In early 2011, iron ore export volume fell owing to production disruptions from a higher than average number of cyclones in the north of Western Australia. However, iron ore export volumes recovered strongly over the rest of the year to reach new highs, reflecting expansions in the capacity of mines and rail as well as some improvements in the utilisation of port facilities.


Wednesday, May 2, 2012

Commodity Prices: Is the Boom Over?

Commodity prices are seemingly heading downwards. After a little rise last month, they have fallen again.Given Australia's dependence on commodity exports, the future direction of prices matters a lot.

The long flat period of prices is a major reason why Australians were gloomy about Australia's future as a lucky country reliant on resources. But pow, along came the boom in prices, which started in late 2003 and which continued almost 'exponentially' until December 2008.

That sudden drop was reversed in August 2009, surprising many pundits (including me) and was built largely on fiscal expansion, particularly in China.

Now the real question is what happens in the next 3-5 years and beyond. Will prices fall rapidly or will continuing growth in China and India keep demand for commodities high. What will be the impact of the massive increase in supply of resources that has taken a long time to come on board, but is now beginning to effect prices.

The real danger is that we have declining demand at the same time as increased supply, which as economics 101 tells us will lead to lower prices.

The following charts and data are from and based on RBA data available here. See also here for explanation.


If the figures are disaggregated we can see that base metal prices have fallen even further. This too matters a lot because base metals are significant export commodities.

 
 Rural commodity prices have also fallen and as you can see are much more variable than base metals.


Our most important exports - iron ore and coal - are included under the category other resources. According to the RBA:
Table 1 shows the current and updated weights for the commodity exports included in the ICP. It also shows implied effective weights for September 2009, which reflect the extent to which the current value of the index already incorporates changes to export prices that have already occurred since 2008/09. With the new weights, the relative importance of ‘other resources’ has increased substantially compared with the weights based on export values in 2001/02. These components, which include metal ores, gold and energy commodities, now account for around 75 per cent of the index, and more than 80 per cent once crude oil is also included. The weight of the rural commodities included in the ICP has declined to around 10 per cent from around 30 per cent in 2001/02, and the weights of the base metals included have also declined. These reductions mainly reflect the more moderate pace of growth in export volumes in rural commodities and base metals compared with other resource commodities since 2001/02, as well as the introduction of crude oil prices into the ICP.

Given these perameters, the final chart is based on the Base Metal and Other Resource prices.


The final graph  is the same as the first for all commodities, but expressed like the next two charts in US$, A$ and SDR (special drawing rights), which is represented by a basket of currencies made up of the euro, Japanese yen, pound sterling, and U.S. dollar. The value of the SDR " is calculated as the sum of specific amounts of the four basket currencies valued in U.S. dollars, on the basis of exchange rates quoted at noon each day in the London market."


As you can see the rise in the value of commodity prices has not been as extensive in Australian dollar terms as it has been on USD and SDR terms because the AUD has risen against the USD (a major component of the SDR).