Tuesday, February 5, 2013


Monday, February 4, 2013
The Transformation of Global Telecommunication: How is Australia Doing?
During my early years of studying economic globalisation in the late 1990s I was astounded to learn that a majority of the world's population had not even used a telephone, let alone used a computer or accessed the Internet. This was mainly because the costs of telecommunications infrastructure were so high. Poles and wires cost a lot of money.
Mobile phones have changed all that. Suddenly, communication could take place through relatively inexpensive mobile phones, whose infrastructural requirements were far less onerous.
There is still a long way to go, however; despite the massive growth in access to mobile phones, around two-thirds of the world's population is still not on-line.
The International Telecommunications Union (ITU) provides a statistical picture of global telecommunications. Made up of 193 Member States, academic institutions and around 700 private companies, the ITU, according to its website, is
The last available data on ICTs is from June 2012 and makes the case for an ongoing remarkable transformation.
Put in graphic form, these stats look like this.

The Australian Bureau of Statistics also provides data on Internet activity in Australia. In June 2012, there were 12.0 million Internet subscribers in Australia, an increase of 4% since the end of December 2011 and an annual growth of 10 per cent.
In 2006 dial-up dominated, but by 2012 96 per cent of Internet connections were broadband.


According to the ABS, "5.9 million subscribers were using mobile wireless connections while 4.6 million were using DSL".
Download speeds have also been increasing: "The number of connections at the top end of the speed ranges (24Mbps - 100Mbps and 100Mbps or more) grew by 20% and 34% respectively, since December 2011, accounting for 1.5 million subscribers."
Australians are becoming more Internet and mobile phone oriented, but there is still some way to go before Australia joins the global top 10 in the ICT world.
Mobile phones have changed all that. Suddenly, communication could take place through relatively inexpensive mobile phones, whose infrastructural requirements were far less onerous.
There is still a long way to go, however; despite the massive growth in access to mobile phones, around two-thirds of the world's population is still not on-line.
The International Telecommunications Union (ITU) provides a statistical picture of global telecommunications. Made up of 193 Member States, academic institutions and around 700 private companies, the ITU, according to its website, is
the United Nations specialized agency for information and communication technologies – ICTs. We allocate global radio spectrum and satellite orbits, develop the technical standards that ensure networks and technologies seamlessly interconnect, and strive to improve access to ICTs to underserved communities worldwide.
ITU is committed to connecting all the world's people – wherever they live and whatever their means. Through our work, we protect and support everyone's fundamental right to communicate.Lofty ambitions indeed and while the role of the ITU in the spread of ICTs is difficult to measure, the increased global access to mobile phones is not. Mobile phones have had a profound affect on virtually the entire world, including some of the poorest countries. There is, however, a long way to go on the global communications front, especially in terms of access to broadband in developing countries.
The last available data on ICTs is from June 2012 and makes the case for an ongoing remarkable transformation.
Mobile Cellular
- Total mobile‐cellular subscriptions reached almost 6 billion by end 2011, corresponding to a global penetration of 86%.
- Growth was driven by developing countries, which accounted for more than 80% of the 660 million new mobile‐cellular subscriptions added in 2011.
- In 2011, 142 million mobile‐cellular subscriptions were added in India, twice as many as in the whole of Africa, and more than in the Arab States, CIS and Europe together.
- By end 2011, there were 105 countries with more mobile‐cellular subscriptions than inhabitants, including African countries such as Botswana, Gabon, Namibia, Seychelles and South Africa.
- Countries where mobile‐cellular penetration increased the most in 2011 include Brazil, Costa Rica, Kazakhstan, Lao P.D.R. and Mali.
Mobile Broadband:
- By end 2011, there were more than 1 billion mobile‐broadband subscriptions worldwide.
- Mobile broadband has become the single most dynamic ICT service reaching a 40% annual subscription growth in 2011. Although developing countries are catching up in terms of 3G coverage, huge disparities remain between mobile‐broadband penetration in the developing (8%) and the developed world (51%).
- In Africa there are less than 5 mobile‐broadband subscriptions per 100 inhabitants, whereas all other regions have penetration levels above 10%.
- By end 2011, there were more mobile‐broadband subscriptions than inhabitants in the Republic of Korea and Singapore. In Japan and Sweden, active mobile‐broadband penetration surpassed 90% by end 2011.
- In 2011, 144 million mobile‐broadband subscriptions were added in the BRICS (Brazil, the Russian Federation, India, China and South Africa), accounting for 45% of the world’s total subscriptions added in 2011.
Fixed (Wired) Broadband:
- By end 2011, there were 590 million fixed (wired)‐broadband subscriptions worldwide.
- Fixed (wired) broadband growth in developed countries is slowing (5% increase in 2011), whereas developing countries continue to experience high growth (18% in 2011).
- Fixed (wired)‐broadband penetration remains low in some regions, such as Africa and the Arab States, with 0.2% and 2% respectively by end 2011.
- In 2011, 30 million fixed (wired)‐broadband subscriptions were added in China, about half of the total subscriptions added worldwide, and fixed (wired)‐broadband penetration reached 12% in the country.
- Top performers – such as France, Denmark, the Netherlands, Norway, the Republic of Korea and Switzerland – had fixed (wired)‐broadband penetrations above 35% by end 2011.
- Countries where fixed (wired)‐broadband penetration increased the most in 2011 include Bahrain, Costa Rica, Ecuador, Mauritius and Uruguay. However, among these, only Bahrain and Uruguay surpassed the 10% fixed (wired)‐broadband penetration by end 2011.
Internet:
- The percentage of individuals using the Internet continues to grow worldwide and by end 2011 2.3 billion people were online.
- In developing countries, the number of Internet users doubled between 2007 and 2011, but only a quarter of inhabitants in the developing world were online by end 2011.
- The percentage of individuals using the Internet in the developed world reached the 70% landmark by end 2011. In Iceland, the Netherlands, Norway and Sweden more than 90% of the population are online.
- By end 2011, 70% of the total households in developed countries had Internet, whereas only 20% of households in developing countries had Internet access. Some outstanding exceptions include Lebanon and Malaysia with 62% and 61% of households with Internet respectively.
- Total international Internet bandwidth increased seven‐fold over the last five years reaching 76’000 Gbit/s by end 2011. This equates to 34’000 bit/s per Internet user worldwide.
- Major differences in Internet bandwidth per Internet user persist between regions: on average, a user in Europe enjoys 25 times as much international Internet capacity as a used in Africa.
Put in graphic form, these stats look like this.

The statistics show the simple fact that the greater the costs of infrastructure, the less likely it is that developing country populations will have access to the technology. Mobile phone applications are the wave of the future in the developing world. As predicted many years ago fixed-line telephones are on the way out. What is worth pondering for the future is whether fixed-broadband subscriptions will meet a similar fate in years to come.
As noted above, access to the Internet has been growing rapidly but still has some way to go, especially in the developing world. Amazingly, nearly 30 per cent of the developed world still does not use the Internet, while 75 per cent of people in the developing world are not on-line.

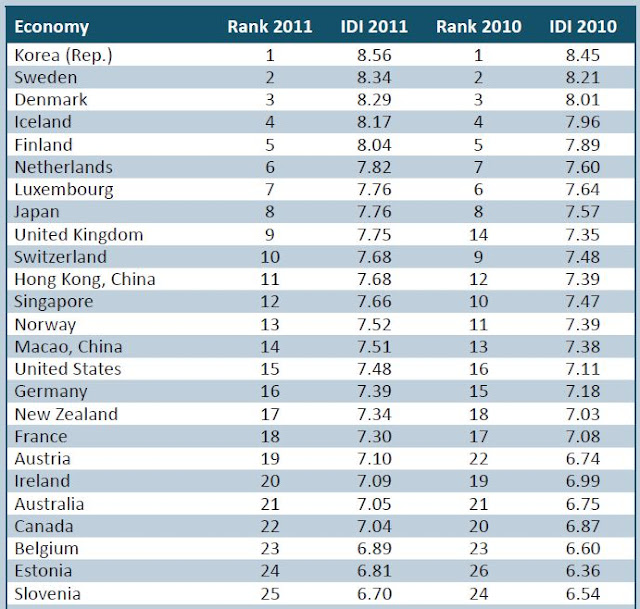
So what about Australia? How are we doing in the ICT world? Compared to our macroeconomic performance we are a definite laggard, although geography no doubt plays some role in this. Engineering ICT infrastructure is a harder and costlier job in Australia than it is in South Korea for example.
To measure ICT prowess, the ITU constructs an ICT index, based on the following parameters.

Australia comes in at a lowly 21st, well behind ICT supremos Korea and the Scandinavian countries. Virtually every Korean household (97 per cent) has an Internet connection and 84 per cent of the Korean population is on the Internet.
According to the ITU, there were 46.6 fixed-telephone subscriptions per 100 Australians in 2011, down from 47.6 in 2010. Australia had 108.3 mobile subscriptions/100 inhabitants in 2011, up from 101.0 in 2010. The percentage of households with a computer was 82.6 per cent in 2011, up from 81.1 per cent in 2010; and 78.9 per cent of households had access to the Internet in 2011, up from 74.1 per cent in 2010.
AIMIA, the Digital Industry Association for Australia, recently conducted a survey on mobile phone usage. In 2012, 76% of those surveyed had a smartphone, up from 67% in 2011. The mobile handset market is still dominated by Apple, with 40% of respondents (up from 32 per cent in 2011) owning an iPhone. Samsung is also improving its position from 13 per cent of respondents in 2011 to 18 per cent in 2012. Nokia is the big loser , dropping from 28 per cent to 16 per cent of respondents.

As noted above, access to the Internet has been growing rapidly but still has some way to go, especially in the developing world. Amazingly, nearly 30 per cent of the developed world still does not use the Internet, while 75 per cent of people in the developing world are not on-line.

So what about Australia? How are we doing in the ICT world? Compared to our macroeconomic performance we are a definite laggard, although geography no doubt plays some role in this. Engineering ICT infrastructure is a harder and costlier job in Australia than it is in South Korea for example.
To measure ICT prowess, the ITU constructs an ICT index, based on the following parameters.

Australia comes in at a lowly 21st, well behind ICT supremos Korea and the Scandinavian countries. Virtually every Korean household (97 per cent) has an Internet connection and 84 per cent of the Korean population is on the Internet.

According to the ITU, there were 46.6 fixed-telephone subscriptions per 100 Australians in 2011, down from 47.6 in 2010. Australia had 108.3 mobile subscriptions/100 inhabitants in 2011, up from 101.0 in 2010. The percentage of households with a computer was 82.6 per cent in 2011, up from 81.1 per cent in 2010; and 78.9 per cent of households had access to the Internet in 2011, up from 74.1 per cent in 2010.
AIMIA, the Digital Industry Association for Australia, recently conducted a survey on mobile phone usage. In 2012, 76% of those surveyed had a smartphone, up from 67% in 2011. The mobile handset market is still dominated by Apple, with 40% of respondents (up from 32 per cent in 2011) owning an iPhone. Samsung is also improving its position from 13 per cent of respondents in 2011 to 18 per cent in 2012. Nokia is the big loser , dropping from 28 per cent to 16 per cent of respondents.

The Australian Bureau of Statistics also provides data on Internet activity in Australia. In June 2012, there were 12.0 million Internet subscribers in Australia, an increase of 4% since the end of December 2011 and an annual growth of 10 per cent.
In 2006 dial-up dominated, but by 2012 96 per cent of Internet connections were broadband.


According to the ABS, "5.9 million subscribers were using mobile wireless connections while 4.6 million were using DSL".
Download speeds have also been increasing: "The number of connections at the top end of the speed ranges (24Mbps - 100Mbps and 100Mbps or more) grew by 20% and 34% respectively, since December 2011, accounting for 1.5 million subscribers."
The amount of data downloaded via the internet (excluding mobile handsets) in the three months ending 30 June 2012 was 414,537 TB, a 20% increase since December.
At the end of June 2012, there were 16.2 million mobile handset subscribers in Australia. This represents an increase of nearly 7% over six months. The volume of data downloaded, via mobile handsets, over the three months ending 30 June 2012, was 6,610 TB, an increase of 32% from December 2011.
Australians are becoming more Internet and mobile phone oriented, but there is still some way to go before Australia joins the global top 10 in the ICT world.
Friday, February 1, 2013
China is King of Coal
China is doing well in the production of renewable energy, but it's not doing well enough to make a serious dent in its pollution problems. (click each word for some seriously scary pollution photos).
One of the problems is the growing consumption of coal to fuel its massive manufacturing sector and its incredible infrastructure development.
As the chart below shows, the growth in Chinese coal consumption and its increasing percentage of total global consumption is more than making up for reductions in coal use elsewhere, especially in the developed world.
 As the US Energy Information Administration points out:


The huge increase in global gas supply in recent years, which will grow even further in coming years, may eventually make a difference, but don't count on it happening soon. Without wishing to downplay the importance of renewables, they also are not going to make much difference in Asia for some years yet.
US gas exports are restricted and the US domestic gas glut is providing a fillip to US manufacturing, which suddenly appears more competitive than it has for many a year.
The EIA provides some basic facts on Chinese energy production and consumption.

Slowing growth in 2012, plus lower energy intensity should see some declines in this rapid growth in coming years, but of course this will have a negative effect on Australian exports. China's pollution problem, it seems has been beneficial for Australia (at least in the short term!).
In the meantime, not to worry, you can always buy a can of fresh air or look at a screen of a beautiful blue sky with fluffy white clouds!


One of the problems is the growing consumption of coal to fuel its massive manufacturing sector and its incredible infrastructure development.
As the chart below shows, the growth in Chinese coal consumption and its increasing percentage of total global consumption is more than making up for reductions in coal use elsewhere, especially in the developed world.

Coal consumption in China grew more than 9% in 2011, continuing its upward trend for the 12th consecutive year, according to newly released international data. China's coal use grew by 325 million tons in 2011, accounting for 87% of the 374 million ton global increase in coal use. Of the 2.9 billion tons of global coal demand growth since 2000, China accounted for 2.3 billion tons (82%). China now accounts for 47% of global coal consumption—almost as much as the entire rest of the world combined.
Robust coal demand growth in China is the result of a more than 200% increase in Chinese electric generation since 2000, fueled primarily by coal. China's coal demand growth averaged 9% per year from 2000 to 2010, more than double the global growth rate of 4% and significantly higher than global growth excluding China, which averaged only 1%.As these graphics show (you'll need to go here for the animations!) Asian coal consumption dwarfs the consumption of the rest of the world and Chinese consumption dwarfs that of the rest of Asia. Only Europe and the former Soviet states have reduced their consumption of coal.


The huge increase in global gas supply in recent years, which will grow even further in coming years, may eventually make a difference, but don't count on it happening soon. Without wishing to downplay the importance of renewables, they also are not going to make much difference in Asia for some years yet.
US gas exports are restricted and the US domestic gas glut is providing a fillip to US manufacturing, which suddenly appears more competitive than it has for many a year.
The EIA provides some basic facts on Chinese energy production and consumption.
Chinese demand for energy is driven by its continually expanding economy.Electricity
- China had the most installed generating capacity in the world in 2011, at 1,073 gigawatts, slightly higher than the United States.
- About 80% of China's electricity generation came from conventional thermal sources, primarily coal, in 2011.
- Both China's electric generating capacity and its electricity generation doubled between 2005 and 2011.
Coal
- China was the largest producer and consumer of coal in the world in 2011, and accounted for almost half the world's coal consumption.
- China became a net coal importer in 2009 for the first time in over 20 years.
- China has the third-largest coal reserves in the world.
Oil
- China was the world's second-largest consumer of oil and liquids in 2011, as well as second-largest oil importer (trailing the United States in both categories).
- China's total oil consumption is slated to continue increasing; EIA forecasts that growth in China's demand for oil will represent 64% of projected world oil demand growth during 2011-2013.
Natural gas
- China was the fourth-largest global consumer of natural gas in 2011.
- Use and production of natural gas in China is rapidly increasing; natural gas production more than tripled over the last decade.
- Consumption of natural gas in 2011 was nearly 50% higher than in 2009.
Nuclear
- Nuclear power made up only 2% of total electricity generation in 2010. As of mid-2012, China had 15 operating reactors, with a total capacity of nearly 13 gigawatts, and 26 new reactors under construction, with a capacity of about 29 gigawatts.
Renewables
- While renewables made up a small fraction of the country's total electricity generation, China was the world's leading producer of hydroelectric power in 2010, and the second-largest producer of electricity from wind power.

Slowing growth in 2012, plus lower energy intensity should see some declines in this rapid growth in coming years, but of course this will have a negative effect on Australian exports. China's pollution problem, it seems has been beneficial for Australia (at least in the short term!).
In the meantime, not to worry, you can always buy a can of fresh air or look at a screen of a beautiful blue sky with fluffy white clouds!


Friday, January 25, 2013
World's Most Polluted Cities
Being number one is often a good thing, but having the worst air quality in Australia (according to The Economist) is not a title that many in Brisbane would want. Still at least we don't have to live in Ludhiana or Lanzhou.

Beijing is also currently experiencing a period of very dangerous air quality. According to The Economist:

Beijing is also currently experiencing a period of very dangerous air quality. According to The Economist:
BEIJING is frequently shrouded in dense, yellowish smog so thick that the other side of the road is obscured. But the deadly smog that enveloped the city over the past weekend was so bad that air-quality readings from a monitor on the roof of the American Embassy said simply: "Beyond Index".
The embassy uses the US Environmental Protection Agency's air-quality index (AQI), which measures the concentration of PM 2.5 (total mass of particulate matter of 2.5-micron diameter or smaller per cubic metre).
Such particles are small enough to be inhaled and can damage lungs. The AQI range ends at 500; at one point a reading of 886 was recorded. A reading above 100 is deemed “unhealthy for sensitive groups” and anything above 400 is rated “hazardous” for all. These independent readings have put pressure on the authorities to release more detailed data of their own. A year ago Beijing's municipal officials bowed to public pressure and started reporting data on PM 2.5 for the first time.
But Beijing is not even the most polluted city in China. Using a different but more widely used measure collated by the World Health Organisation of larger particulate matter called PM 10 (total mass of particles of 10-micron diameter or smaller per cubic metre), which allows cross-country comparisons, that dubious honour is bestowed on Lanzhou in the north-western province of Gansu (and the city of Ludhiana in India is more polluted still).
Better data may soon be available. This month China’s Ministry of Environmental Protection announced that 74 cities were to begin monitoring and reporting the levels of multiple pollutants, including PM 2.5, sulphur dioxide, carbon monoxide and ozone.According to the World Health Organisation, the popular refrain that China has most of the world's worst most air polluted cities is not right. The world's worst city in terms of the PM 10 index is Ahwaz in Iran, followed by Ulan Bator
Annual mean PM10 (Particulate matter with diameter of 10 μm or less), by city

Linfen, China
Tianying, China
Sukinda, India
Vapi, India
La Oroya, Peru
Dzerzhinsk, Russia
Norilsk, Russia
Chernobyl, Ukraine
Sumgayit, Azerbaijan
Kabwe, Zambia

Lanzhou doesn't even make it into the top 10!
When it comes to general pollution, China takes the top 2 spots.
According to Time Magazine, the world's most polluted cities (i.e. based not just on air quality) are:
Thursday, January 24, 2013
Australia Compared: Still Better than Rest (especially in buying cars)
Looking at the graphics below on industrial production and car sales it is clear that Europe is still in deep trouble and that the United States is on a tentative road to recovery. Comparatively Australia is doing very well, particularly in the arena of car sales.

Compare these dismal figures for car sales in major markets with the long-term picture of Australian car sales. No wonder Australia is seen by international car companies as an important growth market, despite the relatively small Australian market.


Compare these dismal figures for car sales in major markets with the long-term picture of Australian car sales. No wonder Australia is seen by international car companies as an important growth market, despite the relatively small Australian market.

Friday, January 4, 2013
Who Rules the Internet?
I recently started using DuckDuckGo (DDG) as a search engine. I'm always searching for alternatives to Google not because it's a bad search engine but because I worry about its dominance and its continual search for new ways to make money. Its failure to pay tax also gives me pause for using it. It also annoys me that like Apple, Google tries to lock you into their systems and make cross platform usage difficult.
This led me to wonder what were the current statistics on search engines, web browsers and operating systems. Using DDG I found a fabulous website called NetMarketShare. Bear in mind that stats registered by various organisations can be very different as explained below.
All stats are divided between desktops and mobile/tablets and are for the week previous to this post.
While Apple dominates the mobile/tablet arena, Microsoft still dominates the declining desktop world.

Desktop Operating Systems - Share

Over the past year, iOS has declined and Android increased although its share of the M/T OS declined late in 2012.
Mobile/Tablet Operating Systems - Trend


So the answer to our question is not exactly clear, but Microsoft still dominates desktops, Apple dominates mobiles and tablets and Google owns the search arena.
Having been in universities from the early days of the Internet it seems clear that domination does not last. I remember doing a class in 1994 on downloading documents from the Internet and thinking surely someone will invent a device where I could just press a button to download. Given that I didn't take much notice of the elaborate steps of File Transfer Protocol I was fairly happy when Netscape made all browsing substantially easier.
Netscape eventually succumbed to Explorer and now Explorer is under assault from a wide range of browsers.
Good luck with guessing what will happen.
This led me to wonder what were the current statistics on search engines, web browsers and operating systems. Using DDG I found a fabulous website called NetMarketShare. Bear in mind that stats registered by various organisations can be very different as explained below.
All stats are divided between desktops and mobile/tablets and are for the week previous to this post.
While Apple dominates the mobile/tablet arena, Microsoft still dominates the declining desktop world.
Mobile/Tablet Operating Systems - Share

Desktop Operating Systems - Share

Over the past year, iOS has declined and Android increased although its share of the M/T OS declined late in 2012.
Mobile/Tablet Operating Systems - Trend

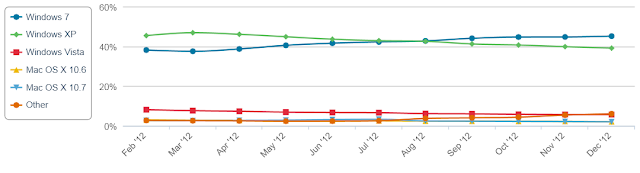
For desktops, Windows 7 took over Windows XP in the middle of the year.
Desktop Operating Systems - Trend
In the browser market Safari dominates for M/Ts, while Explorer dominates Desktop browsers
Mobile/Tablet Browser Shares

Desktop Browser Share

Mobile/Tablet Browser Trend

Desktop Browser Trend

Unfortunately for those wanting definitive statistics, another major collector of web stats StatCounter gives remarkably different figures putting Google Chrome ahead of Windows Explorer.

Over the longer term it's clear that Windows Explorer is losing ground the question is just how much!
Finally in the arena that prompted my little research task, Google dominates both M/T and Desktop search engine usage.
Mobile/Tablet Search Engine Share

Desktop Search Engine Share

Google increased its share of the Desktop Search Engine market over 2012 increasing from 76% to 83%. Chinese search engine Baidu was the big loser according to these stats. Recently, it has been challenged by other Chinese search engines and has no presence outside of China.
Google's share of the M/T search engine market remained relatively static.
Mobile/Tablet Search Engine Trend

Desktop Search Engine Trend

Wikipedia provides a wealth of usage stats including a neat little graphic on the geography of web browser dominance. It also explains why we should take these stats with a sizeable grain of salt.
Usage Share of Web Browsers


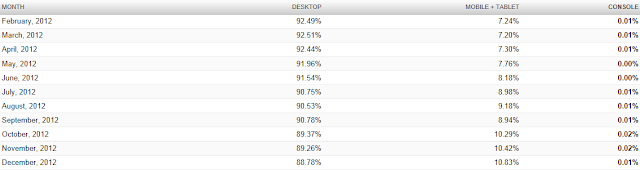
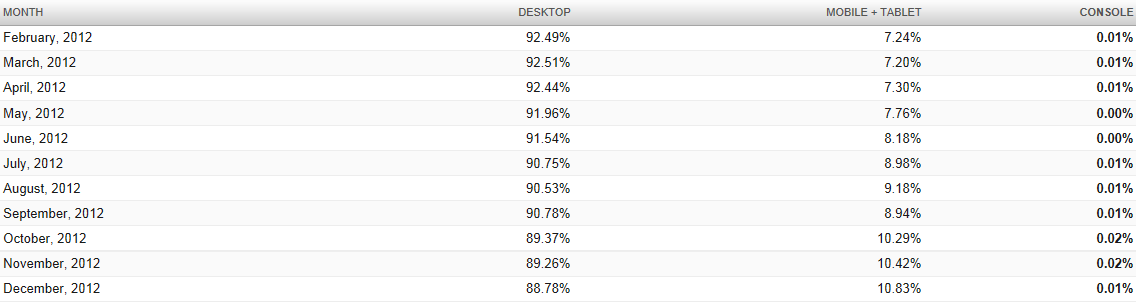
According to NetMarketShare mobile browsing exceeded 10% of total browsing for the first time in 2012, although these stats underestimate the growing importance of the mobile/tablet market because it does not include data on apps or maps.
Browsing by Device Category
So the answer to our question is not exactly clear, but Microsoft still dominates desktops, Apple dominates mobiles and tablets and Google owns the search arena.
Having been in universities from the early days of the Internet it seems clear that domination does not last. I remember doing a class in 1994 on downloading documents from the Internet and thinking surely someone will invent a device where I could just press a button to download. Given that I didn't take much notice of the elaborate steps of File Transfer Protocol I was fairly happy when Netscape made all browsing substantially easier.
Netscape eventually succumbed to Explorer and now Explorer is under assault from a wide range of browsers.
Good luck with guessing what will happen.
Subscribe to:
Posts (Atom)