During my early years of studying economic globalisation in the late 1990s I was astounded to learn that a majority of the world's population had not even used a telephone, let alone used a computer or accessed the Internet. This was mainly because the costs of telecommunications infrastructure were so high. Poles and wires cost a lot of money.
Mobile phones have changed all that. Suddenly, communication could take place through relatively inexpensive mobile phones, whose infrastructural requirements were far less onerous.
There is still a long way to go, however; despite the massive growth in access to mobile phones, around two-thirds of the world's population is still not on-line.
The International Telecommunications Union (ITU) provides a statistical picture of global telecommunications. Made up of 193 Member States, academic institutions and around 700 private companies, the ITU, according to its website, is
The last available data on ICTs is from June 2012 and makes the case for an ongoing remarkable transformation.
Put in graphic form, these stats look like this.

The Australian Bureau of Statistics also provides data on Internet activity in Australia. In June 2012, there were 12.0 million Internet subscribers in Australia, an increase of 4% since the end of December 2011 and an annual growth of 10 per cent.
In 2006 dial-up dominated, but by 2012 96 per cent of Internet connections were broadband.


According to the ABS, "5.9 million subscribers were using mobile wireless connections while 4.6 million were using DSL".
Download speeds have also been increasing: "The number of connections at the top end of the speed ranges (24Mbps - 100Mbps and 100Mbps or more) grew by 20% and 34% respectively, since December 2011, accounting for 1.5 million subscribers."
Australians are becoming more Internet and mobile phone oriented, but there is still some way to go before Australia joins the global top 10 in the ICT world.
Mobile phones have changed all that. Suddenly, communication could take place through relatively inexpensive mobile phones, whose infrastructural requirements were far less onerous.
There is still a long way to go, however; despite the massive growth in access to mobile phones, around two-thirds of the world's population is still not on-line.
The International Telecommunications Union (ITU) provides a statistical picture of global telecommunications. Made up of 193 Member States, academic institutions and around 700 private companies, the ITU, according to its website, is
the United Nations specialized agency for information and communication technologies – ICTs. We allocate global radio spectrum and satellite orbits, develop the technical standards that ensure networks and technologies seamlessly interconnect, and strive to improve access to ICTs to underserved communities worldwide.
ITU is committed to connecting all the world's people – wherever they live and whatever their means. Through our work, we protect and support everyone's fundamental right to communicate.Lofty ambitions indeed and while the role of the ITU in the spread of ICTs is difficult to measure, the increased global access to mobile phones is not. Mobile phones have had a profound affect on virtually the entire world, including some of the poorest countries. There is, however, a long way to go on the global communications front, especially in terms of access to broadband in developing countries.
The last available data on ICTs is from June 2012 and makes the case for an ongoing remarkable transformation.
Mobile Cellular
- Total mobile‐cellular subscriptions reached almost 6 billion by end 2011, corresponding to a global penetration of 86%.
- Growth was driven by developing countries, which accounted for more than 80% of the 660 million new mobile‐cellular subscriptions added in 2011.
- In 2011, 142 million mobile‐cellular subscriptions were added in India, twice as many as in the whole of Africa, and more than in the Arab States, CIS and Europe together.
- By end 2011, there were 105 countries with more mobile‐cellular subscriptions than inhabitants, including African countries such as Botswana, Gabon, Namibia, Seychelles and South Africa.
- Countries where mobile‐cellular penetration increased the most in 2011 include Brazil, Costa Rica, Kazakhstan, Lao P.D.R. and Mali.
Mobile Broadband:
- By end 2011, there were more than 1 billion mobile‐broadband subscriptions worldwide.
- Mobile broadband has become the single most dynamic ICT service reaching a 40% annual subscription growth in 2011. Although developing countries are catching up in terms of 3G coverage, huge disparities remain between mobile‐broadband penetration in the developing (8%) and the developed world (51%).
- In Africa there are less than 5 mobile‐broadband subscriptions per 100 inhabitants, whereas all other regions have penetration levels above 10%.
- By end 2011, there were more mobile‐broadband subscriptions than inhabitants in the Republic of Korea and Singapore. In Japan and Sweden, active mobile‐broadband penetration surpassed 90% by end 2011.
- In 2011, 144 million mobile‐broadband subscriptions were added in the BRICS (Brazil, the Russian Federation, India, China and South Africa), accounting for 45% of the world’s total subscriptions added in 2011.
Fixed (Wired) Broadband:
- By end 2011, there were 590 million fixed (wired)‐broadband subscriptions worldwide.
- Fixed (wired) broadband growth in developed countries is slowing (5% increase in 2011), whereas developing countries continue to experience high growth (18% in 2011).
- Fixed (wired)‐broadband penetration remains low in some regions, such as Africa and the Arab States, with 0.2% and 2% respectively by end 2011.
- In 2011, 30 million fixed (wired)‐broadband subscriptions were added in China, about half of the total subscriptions added worldwide, and fixed (wired)‐broadband penetration reached 12% in the country.
- Top performers – such as France, Denmark, the Netherlands, Norway, the Republic of Korea and Switzerland – had fixed (wired)‐broadband penetrations above 35% by end 2011.
- Countries where fixed (wired)‐broadband penetration increased the most in 2011 include Bahrain, Costa Rica, Ecuador, Mauritius and Uruguay. However, among these, only Bahrain and Uruguay surpassed the 10% fixed (wired)‐broadband penetration by end 2011.
Internet:
- The percentage of individuals using the Internet continues to grow worldwide and by end 2011 2.3 billion people were online.
- In developing countries, the number of Internet users doubled between 2007 and 2011, but only a quarter of inhabitants in the developing world were online by end 2011.
- The percentage of individuals using the Internet in the developed world reached the 70% landmark by end 2011. In Iceland, the Netherlands, Norway and Sweden more than 90% of the population are online.
- By end 2011, 70% of the total households in developed countries had Internet, whereas only 20% of households in developing countries had Internet access. Some outstanding exceptions include Lebanon and Malaysia with 62% and 61% of households with Internet respectively.
- Total international Internet bandwidth increased seven‐fold over the last five years reaching 76’000 Gbit/s by end 2011. This equates to 34’000 bit/s per Internet user worldwide.
- Major differences in Internet bandwidth per Internet user persist between regions: on average, a user in Europe enjoys 25 times as much international Internet capacity as a used in Africa.
Put in graphic form, these stats look like this.

The statistics show the simple fact that the greater the costs of infrastructure, the less likely it is that developing country populations will have access to the technology. Mobile phone applications are the wave of the future in the developing world. As predicted many years ago fixed-line telephones are on the way out. What is worth pondering for the future is whether fixed-broadband subscriptions will meet a similar fate in years to come.
As noted above, access to the Internet has been growing rapidly but still has some way to go, especially in the developing world. Amazingly, nearly 30 per cent of the developed world still does not use the Internet, while 75 per cent of people in the developing world are not on-line.

So what about Australia? How are we doing in the ICT world? Compared to our macroeconomic performance we are a definite laggard, although geography no doubt plays some role in this. Engineering ICT infrastructure is a harder and costlier job in Australia than it is in South Korea for example.
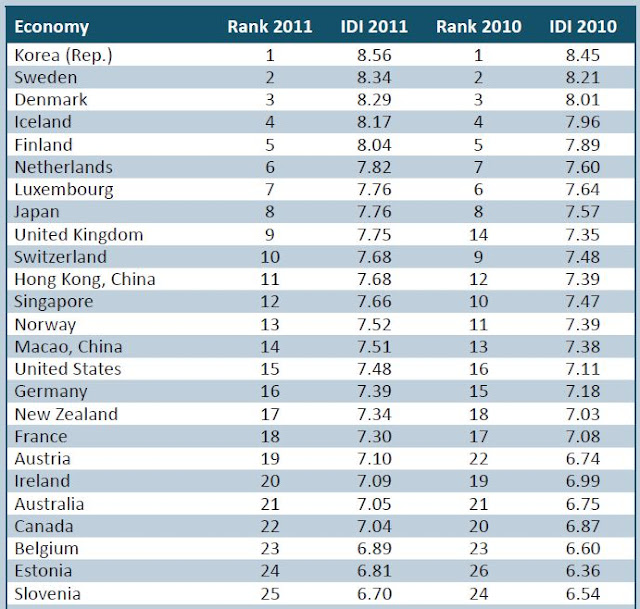
To measure ICT prowess, the ITU constructs an ICT index, based on the following parameters.

Australia comes in at a lowly 21st, well behind ICT supremos Korea and the Scandinavian countries. Virtually every Korean household (97 per cent) has an Internet connection and 84 per cent of the Korean population is on the Internet.
According to the ITU, there were 46.6 fixed-telephone subscriptions per 100 Australians in 2011, down from 47.6 in 2010. Australia had 108.3 mobile subscriptions/100 inhabitants in 2011, up from 101.0 in 2010. The percentage of households with a computer was 82.6 per cent in 2011, up from 81.1 per cent in 2010; and 78.9 per cent of households had access to the Internet in 2011, up from 74.1 per cent in 2010.
AIMIA, the Digital Industry Association for Australia, recently conducted a survey on mobile phone usage. In 2012, 76% of those surveyed had a smartphone, up from 67% in 2011. The mobile handset market is still dominated by Apple, with 40% of respondents (up from 32 per cent in 2011) owning an iPhone. Samsung is also improving its position from 13 per cent of respondents in 2011 to 18 per cent in 2012. Nokia is the big loser , dropping from 28 per cent to 16 per cent of respondents.

As noted above, access to the Internet has been growing rapidly but still has some way to go, especially in the developing world. Amazingly, nearly 30 per cent of the developed world still does not use the Internet, while 75 per cent of people in the developing world are not on-line.

So what about Australia? How are we doing in the ICT world? Compared to our macroeconomic performance we are a definite laggard, although geography no doubt plays some role in this. Engineering ICT infrastructure is a harder and costlier job in Australia than it is in South Korea for example.
To measure ICT prowess, the ITU constructs an ICT index, based on the following parameters.

Australia comes in at a lowly 21st, well behind ICT supremos Korea and the Scandinavian countries. Virtually every Korean household (97 per cent) has an Internet connection and 84 per cent of the Korean population is on the Internet.

According to the ITU, there were 46.6 fixed-telephone subscriptions per 100 Australians in 2011, down from 47.6 in 2010. Australia had 108.3 mobile subscriptions/100 inhabitants in 2011, up from 101.0 in 2010. The percentage of households with a computer was 82.6 per cent in 2011, up from 81.1 per cent in 2010; and 78.9 per cent of households had access to the Internet in 2011, up from 74.1 per cent in 2010.
AIMIA, the Digital Industry Association for Australia, recently conducted a survey on mobile phone usage. In 2012, 76% of those surveyed had a smartphone, up from 67% in 2011. The mobile handset market is still dominated by Apple, with 40% of respondents (up from 32 per cent in 2011) owning an iPhone. Samsung is also improving its position from 13 per cent of respondents in 2011 to 18 per cent in 2012. Nokia is the big loser , dropping from 28 per cent to 16 per cent of respondents.

The Australian Bureau of Statistics also provides data on Internet activity in Australia. In June 2012, there were 12.0 million Internet subscribers in Australia, an increase of 4% since the end of December 2011 and an annual growth of 10 per cent.
In 2006 dial-up dominated, but by 2012 96 per cent of Internet connections were broadband.


According to the ABS, "5.9 million subscribers were using mobile wireless connections while 4.6 million were using DSL".
Download speeds have also been increasing: "The number of connections at the top end of the speed ranges (24Mbps - 100Mbps and 100Mbps or more) grew by 20% and 34% respectively, since December 2011, accounting for 1.5 million subscribers."
The amount of data downloaded via the internet (excluding mobile handsets) in the three months ending 30 June 2012 was 414,537 TB, a 20% increase since December.
At the end of June 2012, there were 16.2 million mobile handset subscribers in Australia. This represents an increase of nearly 7% over six months. The volume of data downloaded, via mobile handsets, over the three months ending 30 June 2012, was 6,610 TB, an increase of 32% from December 2011.
Australians are becoming more Internet and mobile phone oriented, but there is still some way to go before Australia joins the global top 10 in the ICT world.
Thanks for sharing this innovative post.
ReplyDelete