Showing posts with label GDP. Show all posts

Tuesday, March 24, 2015

Redistribution, Inequality, and Growth

An excellent paper by Johnathon D. Ostry, Andrew Berg and Charalambos G. Tsangarides (2014) “Redistribution, Inequality, and Growth’, International Monetary Fund Staff Discussion Note, Washington, DC. <https://www.imf.org/external/pubs/ft/sdn/2014/sdn1402.pdf> argues:
First, more unequal societies tend to redistribute more. Among OECD countries, more inequality tends to be associated on average roughly one-for-one with higher redistribution, such that there is almost no overall correlation between net and market inequality. While the effect is weaker in non-OECD countries, it is nevertheless still present. It is thus important to distinguish between market and net inequality in trying to understand the growth-inequality nexus and to separately control for redistribution in growth-inequality work. 
Second, lower net inequality seems to drive faster and more durable growth for a given level of redistribution. These results are highly supportive of our earlier work, now encompassing not only duration analysis but also the panel regression approach common in earlier literature, and also controlling for the net/market distinction. 
Third, redistribution appears generally benign in its impact on growth; only in extreme cases is there some evidence that it may have direct negative effects on growth. Thus the combined direct and indirect effects of redistribution—including the growth effects of the resulting lower inequality—are, on average, pro-growth. 
Against these results, it must be borne in mind that the data are particularly scarce and unreliable for redistribution, even more so than for inequality. Indeed, one possible interpretation of our results is that the data on redistribution simply do not contain enough information to infer a negative (or for that matter a positive) direct effect. We believe our results are nonetheless informative. We have used the best available data for the analysis of large numbers of countries over time. The analysis of spells inevitably requires the use of older and perhaps less comparable data, but the results for average growth hold even when the analysis is restricted to only the most reliable and recent data.
They conclude:
We have taken advantage of a new comprehensive data set to look at the relationship between inequality, redistribution, and growth; earlier work on the inequality-growth relationship has generally confounded the effects of redistribution and inequality. Our focus has been on the medium and long term, both growth over five-year periods and the duration of growth spells. 
Several important conclusions emerge. 
First, inequality continues to be a robust and powerful determinant both of the pace of medium-term growth and of the duration of growth spells, even controlling for the size of redistributive transfers. Thus, the conclusions from Berg and Ostry (2011) would seem to be robust, even strengthened. It would still be a mistake to focus on growth and let inequality take care of itself, not only because inequality may be ethically undesirable but also because the resulting growth may be low and unsustainable. 
And second, there is surprisingly little evidence for the growth-destroying effects of fiscal redistribution at a macroeconomic level. We do find some mixed evidence that very large redistributions may have direct negative effects on growth duration, such that the overall effect—including the positive effect on growth through lower inequality—may be roughly growth-neutral. But for non-extreme redistributions, there is no evidence of any adverse direct effect. The average redistribution, and the associated reduction in inequality, is thus associated with higher and more durable growth. We need to be mindful about over-interpreting these results, especially for policy purposes. It is hard to go from these sorts of correlations to firm statements about causality. We have not accounted for the possible effects that redistribution may have on market inequality. We have emphasized the uncertainty caused by the scarcity of reliable data, particularly about redistribution. Our measure of redistribution captures only direct taxes and subsidies, for example, so we shed no direct light on the redistributive effects of in-kind government provision of health and education which a priori would seem, if anything, to be more growth friendly than the measures we account for. 
Finally, we know from history and first principles that after some point redistribution will be destructive to growth, and that beyond some point extreme equality also cannot be conducive to growth. We nonetheless see an important positive conclusion from our look at the big picture. Extreme caution about redistribution—and thus inaction—is unlikely to be appropriate in many cases. On average, across countries and over time, the things that governments have typically done to redistribute do not seem to have led to bad growth outcomes, unless they were extreme. And the resulting narrowing of inequality helped support faster and more durable growth, apart from ethical, political, or broader social considerations. This leaves a large research and policy agenda. Even given these results about average effects, it remains important to try to make redistribution as efficient as possible. And further insight into the mechanisms at play would help sharpen our understanding and policy recommendations. Our results here highlight the urgency of this agenda.

Wednesday, June 13, 2012

Not Just Lucky, Good: The Australian Economy in 2012

Prime Minister Julia Gillard is keen to make the point that Australia is not just lucky, it's good and it's good because of good policy.  At the Prime Minister's economic Forum in Brisbane (I'm still waiting for my invitation) she said:
It probably wasn't Gary Player who first said "the harder I work, the luckier I get" but he certainly made that quote his own. He could have been talking about Australia. If we ever were just a lucky country, we're certainly not now.
It's not luck that makes this a top-10 country on low trade barriers, openness to international ideas, sophisticated and independent economic institutions, a list that goes on.
Luck didn't give us the three triple-A ratings which only seven other economies can claim – which no previous Australian government can claim either.
Luck didn't make us a top-two country on the measures that are most important to us: political stability, social mobility, ease of starting a business.
Luck didn't keep us out of the worst global recession in 80 years. 
And luck won't build us a new economy for the future. We have to make it.
The Gary Player quote is of course an old chestnut that John Howard used when people argued that the good economic outcomes were mainly to do with luck, rather than good policy. 
There’s nothing fortuitous or guaranteed about economic prosperity. That old saying of, was it, Arnold Palmer or Gary Player that … the more I practice the luckier I get … what it really means is that the harder you work at good policy, the better the outcome … economic management is not some kind of automatic autopilot thing.
During the 2007 election campaign, Paul Keating argued that John Howard was the beneficiary of both a booming global economy and Labor’s transformational policy reforms of the 1980s and 1990s.
I think the public are quite wise about the economy and governments now and they know that the structural changes of the ‘80s and ‘90s are working. The real question today with the economy growing so rapidly and unemployment so low is why doesn't the tinder box go off? That is, why don't we get the big bang? The big bang in inflation and in wages back into the old dismal cycle? The answer is because of the structural changes. Nothing to do with Mr Costello's economic management … and everything to do with Labor’s structural changes from the ‘80s.
If it were true that public were wise about the economy, then I imagine that the government would be doing better in the polls.

The determination of whether Australia's current favourable predicament is due to luck or skill is only half the problem for analysts of Australia's political economy. Right now the real problem is that most Australians don't seem to be aware of how well things are going for Australia. Part of this has to do with the fact that some people aren't actually doing that well, particularly in relation to others. The aggregate concepts of GDP, terms of trade and so forth are exactly that: aggregate. 

But many Australians are doing well. And in particular more people (per capita) in Australia are doing well than in other countries. Basically Australia is the best country in the world to be living in right now (that is beyond the non-economic reasons as to why living in Australia is so excellent like Australian rules football) 

So why do we have such a negative view of our economic success. A read of Glenn Stevens latest speech provides some of the answers and I've written previously on why I think there are negative perceptions about Australia's economic predicament. To argue that the mining boom is the major problem is just plain wrong. Without the mining boom we'd be doing a lot worse. But, the mining boom has had a negative impact on other tradable sectors of the economy (that is those parts of the economy that export or compete against imports).

The real problem for the government lies with a series of structural changes that are negatively affecting collective perceptions of future prospects.

The first is the long-running shift away from manufacturing towards services and the more recent revitalisation of the mining sector. This has come, to some extent, at the expense of manufacturing and important service industries such as tourism and international education. The following graphs come from a presentation made by the RBA governor to the PM's economic forum. 


The two sectors that have been in major decline are agriculture and manufacturing. For good or bad these are two sectors of the economy that are seen as 'special' and so when they are doing it tough their problems are amplified through the public sphere. 

The second structural change is the shift away from debt-financed consumption and rising housing prices to a higher rate of saving – generally considered under the description deleveraging or simply the paying off or consolidation of debt. The NSW government in its Budget has tried to boost the housing market once again by giving large sums of money to property sellers.

We should really call this second structural change the end of an earlier structural change towards higher debt that’s been going on since the liberalisation of the financial sector. The inability to continue to grow debt even further undermines an important source of growth over the past 20 years

The problem is that household debt remains at historically high levels. 

The third structural change is the tentative shift towards a less pollution-intensive economy through the establishment of a carbon price and support for renewable energy through a variety of schemes and policies.

The first two structural changes are long-running and largely unavoidable without significant and perhaps costly policy interventions, which could cause more problems than they fix. 

The third involves a greater level of immediate political choice. But it has the ability to encourage a shift towards a more diversified, future oriented economic structure. 

And though the introduction of a carbon 'tax' is only likely to have a minor impact in the short-term, the way that debate has polarised the community has added to negative perceptions of the Gillard government. Despite the government's major efforts to redistribute wealth to compensate voters for the price rises associated with the carbon 'tax', it seems that those same voters focus only on increasing costs, particularly the cost of electricity.

All three structural changes have acted together with popular perceptions of government incompetence, profligacy and duplicity – well prosecuted by the opposition and sections of the media – to undermine optimism and support for the government in opinion polls.

I’m not suggesting that these three structural changes fully explain voter dissatisfaction, but they have made a substantial contribution to it. 

I want to finish with some other graphs that should at least allow us to agree that the Australian economy is doing better than most other countries. 

The first is GDP, which shows just how well we've done compared to other advanced economies.  


Another measure which shows the quality of the growth is GDP per capita, which also shows us leading the pack. The real basket case here is the UK economy, which is showing clearly how well austerity works as a solution to recession. The UK is still behind where it was in 2005. Fabulous performance! Take out the German economy and the Euro area would also be doing very poorly. 


The lucky dimension of Australia's success is explained by the terms of trade, which have sky-rocketed in recent years after being in long-term decline for the whole of the twentieth century (see the red line). The forecast is for a significant decline of the terms of trade in coming years - a prediction that makes more informed punters pessimistic. I must admit that I often find myself wondering just how many years can we go without a recession?


One of the major reasons for the high terms of trade is explained by this fabulous graph form the Governor, which shows the relative decline of the US and Europe and the rise of China and India. 


Relative economic decline has been going on since the end of World War II. See here for discussion.

A long-term look at unemployment, also shows how well we've been doing compared to the period before the last recession. In the early 1990s I thought there was a chance that unemployment would continue to trend upwards over economic cycles. I was certainly wrong about that, but those were days where pessimism was perhaps more justified. 


This improved employment outcome has occurred despite a growing percentage of workers since the 1950s as more women entered the labour market. In coming years, the definition of 'working age population' will change as workers stay in the labour market beyond 65, some by choice, others by necessity. It seems certain that as life expectancy increases that working life expectancy will increase. Indeed it will become a fiscal requirement for the state in all economies. 


So cheer up, things could be worse. We could not be having a mining boom and we could have really bad economic policy-makers like those in the UK and Europe who believe that austerity is the solution to economic stagnation.


Friday, June 8, 2012

Good 'Problems' for the Australian Economy

While the global economic situation is precarious at the moment, things could be much, much worse for Australia.

As much as the Coalition and The Australian want to paint the Australian economic news out this week as not quite as good as it actually was, its hard to argue against the proposition that in aggregate Australia is doing very, very well at the moment.

The first news out was the Australian National Accounts. A quarterly expansion of 1.3 per cent was a big surprise.


Mining was obviously the standout, but even manufacturing held steady.

The second result on employment could be spun negatively because the seasonally adjusted unemployment rate increased, but there was actually an increase in overall employment as more people entered the labour force looking for work.

According to the ABS:

SEASONALLY ADJUSTED ESTIMATES (MONTHLY CHANGE)

■Employment increased 38,900 (0.3%) to 11,537,900. Full-time employment increased 46,100 (0.6%) to 8,107,900 and part-time employment decreased 7,200 (0.2%) to 3,430,100.

■Unemployment increased 22,400 (3.7%) to 622,800. The number of persons looking for full-time work increased 6,500 (1.5%) to 430,000 and the number of persons looking for part-time work increased 15,900 (9.0%) to 192,800.

■The unemployment rate increased 0.2 pts to 5.1%. The male unemployment rate was steady at 4.8% and the female unemployment rate increased 0.3 pts to 5.5%.

■The participation rate increased 0.3 pts to 65.5%.

■Aggregate monthly hours worked decreased 4.7 million hours to 1,627.2 million hours.

Another series out from the ABS was on industrial disputes. Despite vast improvments in this area over recent years,  it was surprising (not) to see The Australian, put a negative spin on the figures. The paper reported focused on the fact that industrial disputes were up over the year despite the fact that over the last 3 months they had fallen markedly.


As Luke Williams reported in Crikey:
The latest figures from the ABS indicate if the March 2012 pattern continues the 2012 average would be about 134,000 — still less than the John Howard years of 2005 (228,000), 2004 (379,000), 2003 (439,000), 2002 (259,000), 2001 (394,000) and 2000 (469,100). These figures alone shows how selected it is to call the latest figures a “seven-year high”.
While the number of days lost per industrial disputes increased in 2011 (257,000) when compared with 2010 (126,000), as well as 2009 (132,000) and 2008 (196,000), the number of industrial disputes actually decreased. The 2011 figure was also up from record lows under the unpopular WorkChoices legislation in 2007 with 49,000 days lost, but still comparable to 2006 (132,000 days lost) and 2005 (228,000 days lost).
Overall, the industrial dispute levels continue at an overall trend of historic lows. While the Fair Work Act started operation on July 1, 2009, the average number of working days lost per dispute decreased from 1110 to 558 between 2008 and 2010.
...
Looking through past ABS figures highlights the difference even further — there were 460,000 days lost in 1999, 526,000 in 1998 and 928,500 in 1996. This compares to pre-accord and reform days; there were some 1.3 million days lost in 1987 and a massive 5.42 million in 1973.


Never let the facts get in the way of an ideological message.

The following graph from The Economist shows the  'problem' of the difficulty of finding workers in Australia and why, if the mining boom continues, there will be more foreign workers coming into Australia.


According to The Economist:

UNEMPLOYMENT has reached record levels in many countries. Yet more than a third of employers around the world are still having trouble filling vacancies, according to a ManpowerGroup survey of nearly 40,000 employers in 41 countries. Workers in skilled trades (electricians, plumbers, bricklayers and so on) are in shortest supply, followed by engineers and sales people. Talent shortages are most acute in Asia, particularly in Japan where an ageing population is exacerbating the problem. Only in France has the proportion of employers struggling to find appropriate talent increased significantly since last year (from 20% to 29%). In Italy, by contrast, it has halved from 29% to 14%. Overall, employers are less concerned about the impact of skills shortages than they were in 2011. This may be because companies are becoming more comfortable conducting business in an uncertain environment where talent shortages persist.


Wednesday, March 7, 2012

Recent Graphs on the World and Australian Economies

If you're ever looking for up-to-date graphs on the world and Australian economies, the Reserve Bank of Australia's Chart Pack is a great place to start.

For the world economy as a whole it is clear that growth has slowed over recent times. This is clearly the case for the advanced economies, but is also true for China, India and the rest of Asia.


The graph shows just how significant was the decline in growth in 2008. That rapid recovery there had a lot to do with government spending throughout the world. Increasingly it looks clear that governments throughout the developed world, but especially in Europe may have tightened fiscal policy too quickly leading to lower growth and ironically an inability to pay off debt through the increased tax receipts available when growth is higher. Britain and Ireland are great reminders of the wisdom supposedly learnt in the Great Depression: cutting spending during a recession leads to ... continuing recession! Ta da.

Japan's miserable growth performance continues.


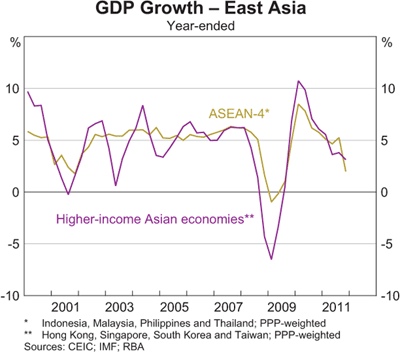
High growth in East Asia has also decelerated.


As have the miracle economies of China and India.


Australia continues to do well considering the world economy.


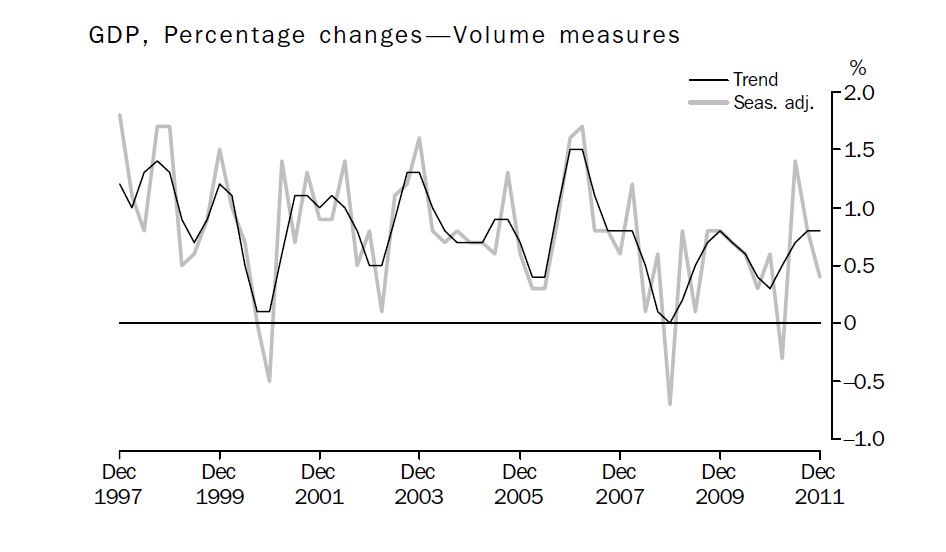
The latest figures from the ABS show that growth in Australia in the December Quarter was slower than expected at 0.4 per cent.

Growth in Australia over 2011 was 2.3 per cent, which is below trend. 


All of those seasonally adjusted downturns went for one quarter only, which means they don't signify a recession.

In terms of contributions to growth, it seems surprising that manufacturing contributed more than mining in 2011!


The manufacturing sector's employment performance was not so good.


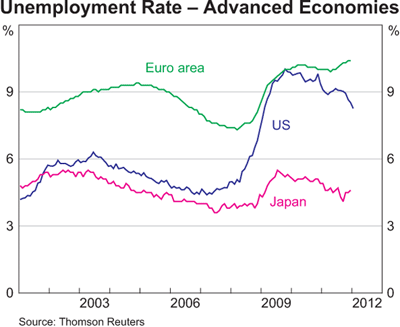
One of the consequences of austerity in Europe is higher unemployment. Sustained high employment is never a good thing in countries with strident Nationalist political parties.


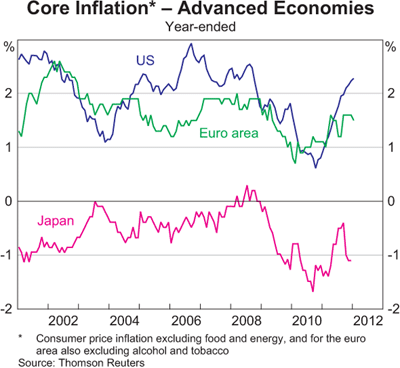
One bright spot for macroeconomic policy is subdued inflation. Some commentators were warning that inflation was in danger of getting out of control in early 2011. This view now appears to be overly hawkish. 


Even worrying trends for higher inflation in China and India have reversed.


Inflation in Australia also remains subdued and is on the way down.  


As Gregory and Sheehan point out many of the price increases over 2011 occurred  in just a few categories:
Over the three years to the June quarter of 2011 five subgroups, out of a total of 90 in the CPI and accounting for about 12% of the index, have provided 40% of the growth in the CPI, and 44% of the growth over the past year. The five groups are lamb and mutton, fruit, vegetables, utilities and tobacco. These five groups in total have risen by 11.9% per annum over the past three years, while the rest of the CPI rose by 1.8%; over the past year the five groups rose by 16.7% and the rest of the index by 2.2%.
Bad luck for those who like lamb chops and three veg and some fruit for dessert (standard evening fair in my family in the 80s. 

China's fiscal and monetary stimulus has clearly come to an end.


What happens to that red line over the coming year will be significant for Australian exports of coal and iron ore.

Next post we'll consider Australian finance and trade. 


Tuesday, January 31, 2012

Economic Austerity is Not Good for You: Forgetting the Lessons of History

Who would have thought cutting government spending in the middle of a slump would lead to lower growth? Anyone with half a brain that's who. I'm not talking about Australia here, but Britain. However, Britain provides an example of what could have happened in Australia if simple-minded austerity politics had operated as per the Coalition's critique of Labor's fiscal expansion during 2008-09. Certainly the fact that the Chinese didn't believe in austerity helped our cause as well.

While China certainly came to the rescue after the slump, according to Treasury (see this also), it is the fiscal expansion that kept Australia out of recession during 2009. Despite revisionist views that it was all about China, it was fiscal expansion that helped Australia to avoid a downturn in business and consumer confidence during 2008 and 2009, which may have led to a negative spiral of increasing unemployment and declining consumption.

Here as a reminder is how bad things were late last decade on a global scale


As Steve Morling and Tony McDonald point out:
As stark as these annual growth figures are, they disguise the speed and extent of the decline in the second half of 2008. In through-the-year terms, world growth fell from 3.8 per cent in the June quarter 2008 to -2.8per cent in the March quarter 2009, a 6.6 percentage point turnaround. The extent of the slowdown over this period was quite similar in the advanced and emerging economies.
A couple of other charts from their paper make interesting viewing.

The first chart shows that the fiscal expansion, hit when it was needed most, during the second half of 2008  and first half of 2009.


If the global economy goes pear shaped in 2012-13, then the government should and probably will make the government contribution to growth help us avoid the severe downturn that will occur elsewhere. Still, what happens in China matters more and more, not just the direct impacts of Chinese demand on Australia but the indirect effects of Chinese demand for the goods and services of other Asian countries, which also helps us to keep growing. Even if Asia has decoupled from the rest of the world (which in the medium term I don't think it has), the countries of Asia have not decoupled from each other.

This second chart shows that the downturn badly affected China as well and our major trading partners in general. During this period of time, Australia was not being saved by China or the rest of Asia.


On a per capita basis Australia's growth performance was not as exemplary. Remember that GDP per capita is a much better measure of progress than aggregate GDP, which can be bolstered, as it has been throughout Australian history, by population increases.


Another interesting chart shows the differences between Australia's economic structure and the OECD average. In the 1980s these differences were seen as likely to lead to Australia falling down the rankings of of advanced economies. Now they are seen as a fundamental factor in our economic success. It is possible, if Australian policy-makers don't work to diversify the economy, that in 20 years time we might be making the same arguments about the Australian economy that were made in the 1980s.


Labor's determination, therefore, to produce a surplus sooner rather than later is not the same thing because of Australia's better and sustained recovery (so far) from the downturn on the back of Asian demand (remember the Asia story is much more than just China). The government was right to get the budget balance in order, while the sun's been shining. Indeed, they might have had a better shot at this if they'd raised taxes on mining profits sooner rather than later.

Wayne Swan and Treasury realise that if global growth falls off a cliff then they have room to manoeuvre to again support the economy through fiscal expansion (i.e. government spending).

While there may be too much focus on Europe's possible negative effects on Australia at the moment, it's important to remember that Europe as a whole accounts for about 40 per cent of global GDP. (The European Union itself is a larger economy than the United States).

The difficulty in the face of a return to a renewed global recession might be in ignoring those who believe that governments should be more like virtuous households - with a keen saving and protestant work ethic.

Instead they will have to make a case that increasing government spending will be a necessary move to avoid a downward economic spiral that could be caused by stupidly believing that austerity is a suitable policy during a slump. Expect the Coalition to go on about unsustainable public debt. Just make sure you realise that this is rubbish. The aim of government fiscal and monetary policy during a downturn should be to maintain aggregate demand. The Rudd government and the Reserve Bank did a good job during the last global recession, let's hope that they do an equally fine job during the coming downturn.

The major example of stupid austerity has been Britain, which has gone from bad to worse as far as growth is concerned. Paul Krugman nicely captures the perverse reasoning in the UK of so-called "expansionary austerity", wherein advocates argued that cuts in government spending would encourage confidence in the business sector and lead to investment, jobs and finally consumption. Krugman begins by quoting UK PM, David Cameron:
“Those who argue that dealing with our deficit and promoting growth are somehow alternatives are wrong,” declared David Cameron, Britain’s prime minister. “You cannot put off the first in order to promote the second.”
But this is faith of the highest order, based on the same sort of logic as the Laffer Curve.
How could the economy thrive when unemployment was already high, and government policies were directly reducing employment even further? Confidence! “I firmly believe,” declared Jean-Claude Trichet — at the time the president of the European Central Bank, and a strong advocate of the doctrine of expansionary austerity — “that in the current circumstances confidence-inspiring policies will foster and not hamper economic recovery, because confidence is the key factor today.”
Such invocations of the confidence fairy were never plausible; researchers at the International Monetary Fund and elsewhere quickly debunked the supposed evidence that spending cuts create jobs. Yet influential people on both sides of the Atlantic heaped praise on the prophets of austerity, Mr. Cameron in particular, because the doctrine of expansionary austerity dovetailed with their ideological agendas.
Instead what has happened has been - surprise, surprise - lower growth. According to a recent National Institute of Economic and Social Research press release:
output [in Britain] grew by 0.1 per cent in the three months ending in December after growth of 0.3 per cent in the three months ending in November. This implies the economy expanded by 1 per cent in 2011, half the rate of growth experienced in 2010 (2.1 per cent).
Krugman highlights an interesting graph from the NIESR (but doesn't show it) that reveals that in terms of growth Britain is doing worse than during the Great Depression.
Last week the National Institute of Economic and Social Research, a British think tank, released a startling chart comparing the current slump with past recessions and recoveries. It turns out that by one important measure — changes in real G.D.P. since the recession began — Britain is doing worse this time than it did during the Great Depression. Four years into the Depression, British G.D.P. had regained its previous peak; four years after the Great Recession began, Britain is nowhere close to regaining its lost ground.
Here's the graph:


Given the rhetoric of the Conservatives one would think that Britain's public debt situation is unparalleled. In terms of British history it is not even close to the high debt levels of the past.


The problem for the present and near-term is that low growth is not confined to Britain, which is still an important economy in the global scheme of things despite its long term relative economic decline. Other still important economies are also doing poorly.
Italy is also doing worse than it did in the 1930s — and with Spain clearly headed for a double-dip recession, that makes three of Europe’s big five economies members of the worse-than club. Yes, there are some caveats and complications. But this nonetheless represents a stunning failure of policy.
And it’s a failure, in particular, of the austerity doctrine that has dominated elite policy discussion both in Europe and, to a large extent, in the United States for the past two years.
O.K., about those caveats: On one side, British unemployment was much higher in the 1930s than it is now, because the British economy was depressed — mainly thanks to an ill-advised return to the gold standard — even before the Depression struck. On the other side, Britain had a notably mild Depression compared with the United States.
Even so, surpassing the track record of the 1930s shouldn’t be a tough challenge. Haven’t we learned a lot about economic management over the last 80 years? Yes, we have — but in Britain and elsewhere, the policy elite decided to throw that hard-won knowledge out the window, and rely on ideologically convenient wishful thinking instead.
Krugman goes on to talk about the United States, whose policy-makers he believes need to be more focused on expansion, despite the high level of government debt. Those following the US debate know that many economic and political commentators believe that there needs to be austerity à la Britain if the United States is going to break out of along period of low growth.

But this is madness, at least in the short-term. Krugman is thankful that the Obama Administration did not follow the expansionary austerity stupidity.
Which is not to say that all is well with U.S. policy. True, the federal government has avoided all-out austerity. But state and local governments, which must run more or less balanced budgets, have slashed spending and employment as federal aid runs out — and this has been a major drag on the overall economy. Without those spending cuts, we might already have been on the road to self-sustaining growth; as it is, recovery still hangs in the balance.
And we may get tipped in the wrong direction by Continental Europe, where austerity policies are having the same effect as in Britain, with many signs pointing to recession this year.
The infuriating thing about this tragedy is that it was completely unnecessary. Half a century ago, any economist — or for that matter any undergraduate who had read Paul Samuelson’s textbook “Economics” — could have told you that austerity in the face of depression was a very bad idea. But policy makers, pundits and, I’m sorry to say, many economists decided, largely for political reasons, to forget what they used to know. And millions of workers are paying the price for their willful amnesia.
Too many people think of an economy as just a big household. It's a good thing for families to increase their savings during a downturn - it's a little boring perhaps, but a good idea - because if times get even worse, i.e. if you lose your job or get fewer hours, then extra savings will perhaps help you and your family get through tough times.

This is not true, however, for an economy as a whole. The more people save the less they spend, leading to what Keynes called the 'paradox of thrift', wherein ‘virtuous’ efforts to reduce debt cause a decline in demand and a downturn in the economy. 

Remember that GDP = private consumption + gross investment + government spending + (exports − imports). That is:

GDP  = C  + I + G + (X - M)

Simple maths would tell you that if you reduce private consumption or government spending and don't get a corresponding increase in investment, then the end result will be an economic contraction.

The problem for Australia, as I highlighted recently, is the end of the debt-fuelled growth model that spurred growth from the early 1990s til 2007. This is a major structural change for the Australian economy, although it might be better seen as the end of an earlier structural change that began with financial liberalisation and gathered pace as credit markets expanded over the 1990s and kept going until 2007 when the music stopped and not everyone found a chair.

As I outlined in that late 2011 post:
The growth of household debt as a percentage of disposable income grew rapidly over the 1990s and 2000s rising from:

48% in September 1990 to 156.7% in June 2007 to 150.8% in September 2011.
Debt for housing is 89.7 % of total household debt.
Investor housing debt is 29% of total household debt.
Interest payments as a percentage of disposable income reached a high of 13.4% in June 2008 to a low of 9.3% in June 2009 to 11.4% in September 2011. (see my article Structural Shenanigans for graphics).
So ... household debt remains at high levels and the inability to continue to grow debt even further undermines an important source of growth over the past 20 years.
Think about it.

The growth that occurred after the recovery of the 1990s recession was augmented, buttressed and sometimes driven by the expansion of household debt by around 100% of disposable income.
If we were to have the same favourable conditions over coming years this would mean that household debt as a percentage of disposable income would have to go to 250% of income.
While I've always been a keen user of credit cards, even I couldn't sustain the amount of debt repayments as a percentage of disposable income that this level of debt implies.

While households in aggregate have less room to move in terms of increasing GDP (the C part of our GDP equation), government in Australia (the G part of the equation) has much more room to move if things go badly in Europe, Asia and the United States.

We must hope that those successful communists in China keep managing their economy in such a way that benefits Australians. Over the short and medium-term it continues to be important that we debate the wisdom of increasing reliance on the mining sector and on China.


Wednesday, November 9, 2011

The Size of the Mining Sector

The mining sector is directly related to about 9 per cent of gross value-added (one way of calculating GDP - i.e. the production measure). But obviously the mining sector makes a bigger contribution than this through a range of indirect effects on other sectors of the economy, particularly construction.

In the Reserve Bank of Australia's August Statement on Monetary Policy they had an interesting little Box on "Measuring the Mining and Non-mining Sectors"
Measuring the output of any particular sector is difficult because of the numerous interconnections between sectors. In the production side of the national accounts, the ABS estimates gross value added (GVA, defined as gross output less non-labour intermediate inputs) for the mining sector, which, at around 9 per cent of GDP, is the second-largest single sector after finance and insurance.
However, this estimate does not include the value of output in sectors closely linked to mining production: for example, when Queensland coal production fell around the start of this year, so too did output of rail transportation and port services partly because coal exports had fallen. Furthermore, this measure does not include most investment in mining, which is typically attributed to the value added of the construction (and other) sectors.
Another approach uses data from the expenditure side. Based on a number of assumptions, it is possible to come up with alternative estimates of output in the mining and non-mining sectors, at least at the annual frequency. This is broadly the approach used by Statistics Norway in estimating ‘offshore’ and ‘mainland’ GDP. A simple estimate of output related to the mining sector can be obtained as follows[2]:
- the volume of resource exports, which is available at a quarterly frequency
- plus real investment by the mining sector, which is available on an annual basis in the annual national accounts
- less an estimate of the imported component of mining investment. Given that there are no official data for this, the estimates that follow are RBA staff estimates, based on data for total capital imports and information from liaison with mining companies.
Given the uncertainties, any results are best treated as illustrative. Overall, the estimates suggest that activity in the broadly defined mining sector represented around 14¾ per cent of GDP at current prices in 2010/11, with mining exports of 12½ per cent of GDP and ‘net’ mining investment (excluding the imported component) around 2¼ per cent.
These estimates also suggest that activity in the mining sector has grown at a faster pace than in the non-mining sector over the past three decades. Activity related to the mining sector has grown in real terms at an annual rate of about 5½ per cent over this period, while activity in the non-mining sector has grown at an annual rate of about 3 per cent. The gap between growth in the mining sector and the rest of the economy has increased somewhat in recent years after narrowing in the first half of the 2000s. Over the six years to 2010/11, annual growth in non-mining sector activity is estimated at around 2¼ per cent, versus growth in mining activity of 6¼ per cent.
There has also been significant divergence in the experience of industries outside the mining sector, with growth in some services sectors quite strong, but weaker growth in some trade-exposed sectors.
The RBA notes, however, that the contribution of the mining sector goes well beyond these measurements ... as does the contribution of the manufacturing sector. They are concerned with income effects, but there are also service industries etc. I'm on the lookout for an impartial estimation of these indirect effects (i.e. one not funded by the mining sector itself.)
It should be stressed that these estimates are based on that part of output that is directly related to the mining sector and do not capture the broader income effects throughout the economy. As the Bank has noted frequently, recent developments in the mining sector and in commodity prices have had a range of flow-on effects throughout the economy, including via wealth effects, higher dividend flows to households, higher tax and royalty payments to governments, and effects on the exchange rate (which have reduced the price of imported goods and services for households and businesses).
What the graphs show is the greater level of volatility in mining gross value-added and GDP.
as mining investment and exports continue to increase, growth in the non-mining economy is likely to remain slower than growth in overall GDP. As the structure of the economy adjusts to the large change in global relative prices, the increased size of the mining sector means that overall GDP will be more affected by any volatility in mining sector activity. This highlights the importance of data that will allow more detailed analysis of the mining and non-mining sectors.