Friday, March 9, 2012

Graphs that Show a Little Pain: Mining, Manufacturing and Services

In my last post I included a graph showing the high level of mining investment past, current and prospective. The graph was from a speech the other day by Deputy Governor of the RBA Philip Lowe elegantly titled "The Changing Structure of the Australian Economy and Monetary Policy" 

The happy graph is this one. 


Mining investment is as high as its ever been in Australia, but this doesn't necessarily mean that all is fine in the Australian economy.

Lowe also discusses a range of other graphs that show how some parts of the economy are struggling.

The first graph below uses 2000 as its starting point and considers outcomes since that time.  Manufactured exports were growing substantially until the GFC, with the parts of the sector clearly becoming more export oriented (consider exports in ratio to output). Part of the cost of this transition was a gradual decline in employment. Since the GFC, exports and outputs have recovered somewhat although still well below the pre-crisis peak and well below the general recovery in world manufacturing trade, which has exceeded pre-crisis highs. Unemployment in the sector, meanwhile, has fallen in a hole.

It's harsh to say it, but the survival of the manufacturing sector (and remember that it's a remarkably varied sector) is probably dependent on more job losses as firms restructure and focus on higher value-added activities. Steel production, for example, is not going to survive in its current form. Car production is also probably dead in the water over the longer-term unless the government does something more than simply providing regular gifts to American and Japanese car companies to keep producing cars in Australia.

Just imagine the potential results for Australia's hi-tech manufacturing future if just 10 per cent of that largess delivered to American and Japanese investors had been put into research on new engine technology. Instead we paid the car companies to keep producing cars that fewer and fewer people wanted.


There is some indication that the manufacturing sector is restructuring in a good way in that a greater percentage of firms are embracing new operational processes than in other industries. Once again this means higher productivity and clearly fewer employees as a percentage of output. Currently manufacturing employs about 950,000 people and accounts for about 9% of output. As Lowe argues:

Realistically, Australia cannot hope to be a large-scale producer of relatively standardised, plain-vanilla, manufactured goods for the world market. But what we can be is a supplier of manufactured goods that build on our comparative advantages: our educated workforce; our ability to design and manufacture specialised equipment; our reputation for high-quality food; our research and development skills; and our expertise in mining-related equipment.
Inevitably, the high exchange rate means that the manufacturing industry has little choice but to move up the value-added chain in order to compete. This is, of course, a lot easier to say than to do. It means difficult changes for many firms and those who work for them. It also means ongoing investment in human capital and the latest machinery and equipment and constant attention to improving productivity. One piece of evidence that things are moving in this direction is in the ABS business characteristics survey, which asks firms a series of questions about innovation. In this survey the manufacturing sector clearly stands out as one where firms are actively reviewing their business practices and, over recent times, they have been doing this more frequently.


Two significant sub-sectors that have been growing are "professional and scientific" and "specialised machinery", while cars and metals and construction manufactures are in a dangerous decline. The problem for the car industry is that there is overproduction throughout the world and especially in Europe.


Another sector that has been doing poorly is tourism, although some sectors of the accommodation sector have not been doing so badly, highlighting that there is restructuring going on within sectors, not just between them (as in manufacturing above).

As those of us who live in Queensland will have noticed, tourism is in deep trouble. Sydney, however, is doing well as business travel remains high and as tourists seek city-based experiences rather than coast-based experiences. The floods and La Nina have probably not helped Queensland tourism.


Another sector that is going through a tough time is the real estate industry. Not only are prices in decline, but turnover rates have more than halved from their peak in the early 2000s. The fall over the last few years has also been significant. The trend is clear despite a couple of rises before and after the GFC. I live near a high street that must contain at least 6 real estate agencies on one side of the road over a distance of no longer than 200m. Might be difficult to maintain that sort of penetration of Logan Rd Holland Park if the turnover trend charted below continues.


As with accommodation, retail is a sector with varying fortunes. Clothing, footwear and accessories are doing poorly as are Department stores, but other retailers are doing quite well.


As I argued in The Internet and the Death of Retail the problem for the bricks and mortar part of the sector is not yet because of Internet sales, which are less than 5 per cent of overall sales, with o/s sales even smaller at about 25 per cent of total Internet sales.

Nevertheless, a recent study by the NAB reported that online retail had been growing rapidly, although the rate of growth slowed in the second half of 2011.


Australian retailers are not, therefore, powerless to take advantage of the Internet. Australian businesses, even those with stores, can sell online as well. But a little hint here to Rebel Sports and Super Amart, things have to be cheaper online.

After trying to find some running shoes in the US, I found that many of the cheaper retailers wouldn't sell directly to Australia, although there were companies that would provide you with a US address and then send the goods to your Australian address. This seemed more trouble than it was worth after I found an Australian site - myfootyboots.com - that sold shoes much more cheaply than the bricks and mortar retailers.

Undoubtedly we live in interesting times and clearly some sectors (and sub-sectors) are doing much better than others.

Australia's Trade and Financial Performance

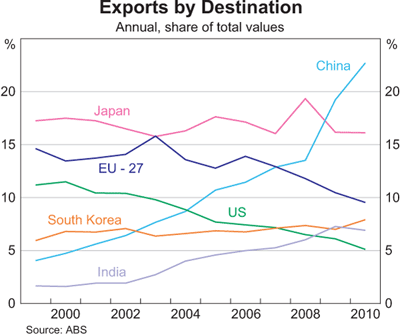
Australia's trade performance has been marked by a shift back towards resources since the early 2000s, with a remarkable shift in trade towards China over the past 10 years from under 5% to about 27% today.

This bonanza is reflected in Australia's terms of trade. 


The terms of trade is an index-measure ratio of the average price level of exports to the average price level of imports. It effectively reflects the capacity of a given quantity of exports to pay for a given quantity of imports, and provides an important indication of the strengths and weaknesses of the economic structure. A rising or falling terms of trade indicates the possibility of improving or declining living standards, because if what we sell earns relatively more than what we buy, we will be relatively wealthier. Because the terms of trade is a ratio, increases can be a result of export prices increasing at a greater rate than import prices, or export prices increasing while import prices are declining, or export prices declining at a slower rate than import prices. Of course, a rising terms of trade doesn’t stop us from buying more things than we sell, which we have made a habit of for much of our history! Improvements in the terms of trade are not reflected in GDP figures, but improvements do contribute significantly to increases in national disposable income.
 
Most commentators now think that the terms of trade has peaked and this appears more clearly in commodity prices. The terms of trade has provided a big income boost to Australia, which is not directly measured in GDP growth figures, but obviously higher income eventually has an impact on growth. Alongside the paying off of debt and the end to the effective increase in real income that comes from a higher exchange rate and lower import prices, these factors makes for a less favourable outlook for Australians over the coming year.


Note the rapid ascent of China as a share of the total and the less dramatic, but still significant growth of India's share. Compare this to the decline of the EU and US shares.


The increase in the volume of bulk commodity exports is a major factor, although the major influence on income has been the increase in prices rather than the increase in volumes.


One of the consequences of the resources boom has been an amazing growth in the level of mining investment. Given that Australia's mining sector is 80 per cent foreign owned (according to the RBA), much of this investment comes from overseas and much of the profit (eventually) also goes overseas. This negative impact on the current account deficit is offset by the positive impact of increased resource exports.

Remember that current account deficits (CADs) can be viewed in two ways (see here for explanation). While both are correct, how commentators measure them is sometimes indicative of ideological proclivities or agendas. For those worried that Australia doesn't generally export enough to cover its imports, the current account deficit is seen as the trade deficit plus the income deficit, which measures the balance of interest and dividend payments away from Australia. The mining sector is a case in point. Given that it is 80 per cent foreign owned a good deal of profits (dividends) flow out of the country. Also give that Australia has a huge foreign (private) debt, a lot of interest payments must be made to foreigners. In this interpretation of the CAD, the solution is to increase exports and cut foreign borrowing. The formula for this version is:  

CA = X - M + NY + NCT

X = Exports of goods and services
M = Imports of goods and services
NY = Net income abroad
NCT = Net current transfers

Remember that the current account can be a CAS i.e. a current account surplus. For the world as a whole deficits and surpluses must match unless we start trading with another planet. See here for further explanation.


The other way of viewing the CAD is to see it as the difference between saving and investment. This is the way most economists, especially Treasury and the RBA prefer to view the CAD because it is an accounting identity. Now obviously the two formulae can be reconciled, but I won't bore you with the details here. 

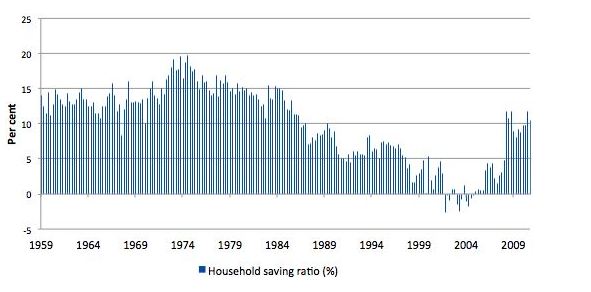
The CAD = Saving - investment approach is also preferred as an explanation because it correctly implies that Australia's CAD is driven by high investment in the mining sector, rather than low saving. Indeed Australian saving has returned to more normal levels since the GFC after a period of negative saving. 


This is from the latest ABS quarterly accounts. 


A longer term view is provided by Bill Mitchell, which shows that saving patterns are simply returning to earlier levels. 


Now if saving increases, this should mean that more Australian investment can be funded domestically, but we are currently going through the biggest mining investment boom in our history. (What is most interesting about this boom is that there is both a massive terms of trade boom and a massive investment boom at the same time). 


The following graph from RBA Deputy Governor Philip Lowe shows just how big is that investment surge.


As a consequence it is not surprising that Australia's foreign financial liabilities remain high.


Wednesday, March 7, 2012

Recent Graphs on the World and Australian Economies

If you're ever looking for up-to-date graphs on the world and Australian economies, the Reserve Bank of Australia's Chart Pack is a great place to start.

For the world economy as a whole it is clear that growth has slowed over recent times. This is clearly the case for the advanced economies, but is also true for China, India and the rest of Asia.


The graph shows just how significant was the decline in growth in 2008. That rapid recovery there had a lot to do with government spending throughout the world. Increasingly it looks clear that governments throughout the developed world, but especially in Europe may have tightened fiscal policy too quickly leading to lower growth and ironically an inability to pay off debt through the increased tax receipts available when growth is higher. Britain and Ireland are great reminders of the wisdom supposedly learnt in the Great Depression: cutting spending during a recession leads to ... continuing recession! Ta da.

Japan's miserable growth performance continues.


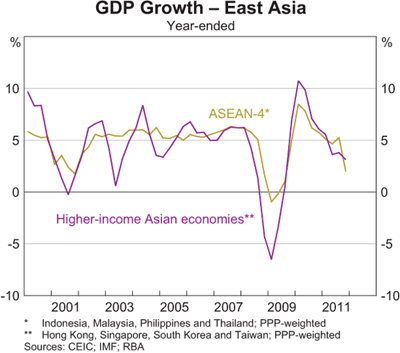
High growth in East Asia has also decelerated.


As have the miracle economies of China and India.


Australia continues to do well considering the world economy.


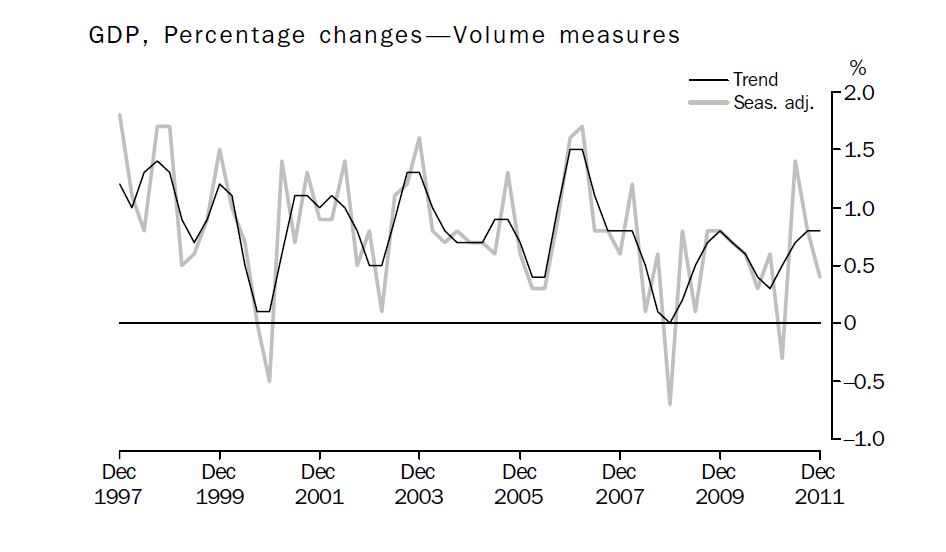
The latest figures from the ABS show that growth in Australia in the December Quarter was slower than expected at 0.4 per cent.

Growth in Australia over 2011 was 2.3 per cent, which is below trend. 


All of those seasonally adjusted downturns went for one quarter only, which means they don't signify a recession.

In terms of contributions to growth, it seems surprising that manufacturing contributed more than mining in 2011!


The manufacturing sector's employment performance was not so good.


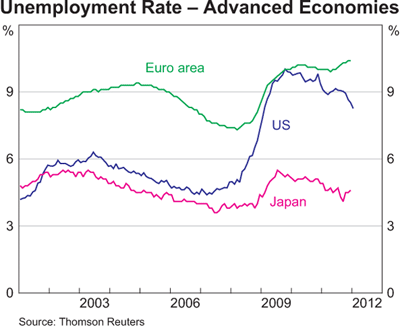
One of the consequences of austerity in Europe is higher unemployment. Sustained high employment is never a good thing in countries with strident Nationalist political parties.


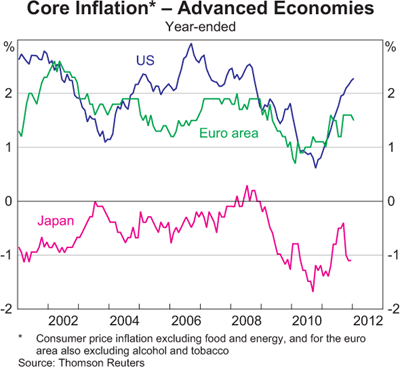
One bright spot for macroeconomic policy is subdued inflation. Some commentators were warning that inflation was in danger of getting out of control in early 2011. This view now appears to be overly hawkish. 


Even worrying trends for higher inflation in China and India have reversed.


Inflation in Australia also remains subdued and is on the way down.  


As Gregory and Sheehan point out many of the price increases over 2011 occurred  in just a few categories:
Over the three years to the June quarter of 2011 five sub‐groups, out of a total of 90 in the CPI and accounting for about 12% of the index, have provided 40% of the growth in the CPI, and 44% of the growth over the past year. The five groups are lamb and mutton, fruit, vegetables, utilities and tobacco. These five groups in total have risen by 11.9% per annum over the past three years, while the rest of the CPI rose by 1.8%; over the past year the five groups rose by 16.7% and the rest of the index by 2.2%.
Bad luck for those who like lamb chops and three veg and some fruit for dessert (standard evening fair in my family in the 80s. 

China's fiscal and monetary stimulus has clearly come to an end.


What happens to that red line over the coming year will be significant for Australian exports of coal and iron ore.

Next post we'll consider Australian finance and trade.