

Thursday, February 16, 2012

The Australian Economy in 2012


When the world economy recovered strongly in 2010, many commentators believed that the great recession was over. In Australia, we still have commentators who fully dismiss that there was any need for action to bolster the Australian economy during 2008 and 2009. This is despite the fact that government guarantees kept the banks afloat (no thanks from the banks for that now), the Reserve bank's monetary stimulus bolstered mortgagees' spending power and Treasury's fiscal stimulus bolstered confidence just at the right time.If you have a look at the graph below you will see that the world economy contracted during this period - an unusual event - and the Australian economy did not.

Successful fiscal stimulus is a bit like averting a terrorist attack. People don't really appreciate what might have been if the action to avert the problem had not been taken.
The subsequent reinvigoration of the Chinese economy through government action also acted to bolster the economy further in 2010, making many people argue that there was no value in the building of school facilities that followed. Anyone who has a child at school or goes to a university will realise that there have been some marvellous facilities built that will benefit students far into the future. The Building the Education Program may have been rushed and it may not have been an effective form of fiscal policy, but it was in the main an effective piece of infrastructure development in Australia.

One building company owner in South Australia made it clear to me that without the prospective work, layoffs would have been significant in his company. So we've been doing fairly well, despite some real and significant problems associated with structural change in the Australian economy.

The Reserve Bank is a prolific publisher of research and its key figures regularly give speeches on the state of the Australian and world economies. Phillip Lowe, the Deputy Governor, gave a speech this morning on "The Forces Shaping the Economy Over 2012.

The first thing to note is that the world economy is expected to do worse than thought in September 2011. Most forecasts have been revised downwards in recent times.


But compared to 2009, this is still a good performance. Europe remains the major problem. According to Lowe:
Working through the various challenges is taking the Europeans time. The process has been frustratingly slow and we have witnessed some missteps along the way. But for all of that, we should not lose sight of the fact that progress is being made. Late last year there was a palpable sense that something might go badly wrong over our summer. Clearly, that has not happened. Instead, government bond yields for some of the troubled countries in Europe have declined a little (Graph 2). Equity markets have picked up and confidence has improved a bit. And significantly, bank debt markets are functioning again, although the cost of issuing bank debt, relative to government yields, is higher than it was in the middle of last year.


Lowe notes that one of the problems for 2012-13 is the fact that many countries are undergoing fiscal consolidation at the same time, providing a significant drag on growth, although he doesn't want to sound too much like a booster.  
Over 2012 and 2013, fiscal policy is set to be quite contractionary in both Europe and the United States as governments attempt to put their public finances on a sounder footing. Indeed, the aggregate fiscal contraction across the advanced economies is likely to be the largest seen for many decades. This is not because the size of the fiscal consolidations in individual countries is unprecedented, but rather because the consolidations are occurring simultaneously in a large number of countries. Unusually, they are also taking place in an environment where output in the affected countries is considerably below potential.

The economic literature is mixed on the effects of fiscal consolidation on growth. There are certainly some examples where consolidation has been associated with fairly strong GDP growth. But in most of these examples, the countries undertaking the fiscal consolidation have benefited from some combination of robust growth in their trading partners, an easing of monetary policy and a depreciation of their exchange rate. Given the nature of the current situation, it is unlikely that the advanced economies, as a whole, can benefit from these factors. There is therefore a material risk that fiscal consolidation weakens growth in the short run, which leads to more fiscal consolidation in order to meet previously announced targets and, in turn, yet weaker growth. We are currently seeing this dynamic play out in a couple of the countries in southern Europe. If it is not to be repeated on a wider scale, the fiscal consolidation in the North Atlantic economies will need to be accompanied by reforms to the supply side that lift the underlying rate of growth of these economies.
In other words widespread fiscal contraction provides a big risk of a negative spiral and a long period of stagnation. All of which is going to be exacerbated by continuing household and wider private sector deleveraging.

The US is increasingly being seen more positively, but it might be too early to open up the champagne just yet.

The US is paying off debt more quickly than many other countries as a recent McKinsey report noted.
Household debt outstanding has fallen by $584 billion (4 percent) from the end of 2008 through the second quarter of 2011 in the United States. Defaults account for about 70 and 80 percent of the decrease in mortgage debt and consumer credit, respectively. A majority of the defaults reflect financial distress: overextended homeowners who lost jobs during the recession or faced medical emergencies found that they could not afford to keep up with debt payments. It is estimated that up to 35 percent of the defaults resulted from strategic decisions by households to walk away from their homes, since they owed far more than their properties were worth. This option is more available in the United States than in other countries, because in 11 of the 50 states—including hard-hit Arizona and California—mortgages are nonrecourse
The report argues that the US is further down the path of deleveraging than Spain or the UK, but the default part of the equation is perhaps no reason to be jumping for joy. McKinsey bases their assumption on a historical trend line of increasing debt and argue that the US may be half way through the deleveraging process.


But think about it this is a trend line from 1955. Eventually the trend line will reach 130% of GDP, perhaps by 2040, which would mean deleveraging during the 2050s could involve a decline from an above trend 140% of GDP ... or whatever. The point is the assumption of an ever-expanding trend line is a furphy. Credit really takes off in the early 1980s with financial liberalisation and the massive expansion of credit that followed. Believing the trend line would mean accepting that eventually. perhaps by 2100, that household debt at 200% of GDP was sustainable.

Comparison with deleveraging in Sweden after their severe financial crisis is quite illuminating. It also makes clear that the UK and Spain also have a long way to go before their episodes of deleveraging are finished.


But anyway the report is well worth a read, just to see why this period of economic stagnation may be a long one. For a look at some comparable figures on Australian household debt see here.

Lowe downplays the impact of China  in the speech:
The Chinese economy is also continuing to grow solidly. The pace of growth has slowed, but it has done so in line with the authorities’ intentions. Inflation in China has also moderated. Across the rest of east Asia, the recent data have been mixed. Nevertheless, for the region as a whole, growth in 2012 is expected to be around trend, with domestic demand likely to play a more important role in generating growth than it has for most of the past two decades.
Let's hope his anodyne assessment is correct.

Lowe then moves to the Australian economy and notes the significance of the once in a lifetime investment that is happening right now.

As you can see from the graph the projected level of investment is huge, belying the regular scare-mongering from the resources sector.

But as many of you will now know this investment has been heavily concentrated in the resource sector and is part of the equation leading to a higher exchange rate.
 

I used to amuse students with stories of the Australian dollar at around 1.50, which seemed rather ridiculous at the turn of the millennium when it hovered around 50%.

Given the importance of the RBA in managing the Australian economy it is worthwhile considering how they see these developments.
The effects of the high exchange rate are evident in the manufacturing, tourism and education sectors, as well as some parts of the agriculture sector and, more recently, in some business services sectors. With the exchange rate having been high for some time now, more businesses are re-evaluating their strategies, as well as their medium term prospects. In some cases, this is prompting renewed investment to improve firms’ international competitiveness. But in other cases, businesses are scaling back their operations in Australia and some are closing down. These changes are obviously very difficult for the firms and individuals involved.  

Both the investment boom and the very high level of the exchange rate are historically very unusual events. This makes it difficult to assess their net effect. It seems, however, that over the past year these forces have balanced out reasonably evenly. 
In other words, don't worry, be happy. While it was slightly cool to be a pessimist before the crash it's now much cooler to be an optimist as a range of recent articles and books have pointed out.


Tuesday, February 7, 2012

Debt, Inequality and Financial Crises

Paul Krugman is a figure of hate for the right in American politics. He is a liberal in the American sense of the word. But he is also an intelligent economic liberal, which means that he realises the benefits of markets and the necessity of government intervention.

In a recent blog post he counters views that he only talks about the Bush property bubble, while ignoring the Clinton stock bubble.
Except I did. Actually, back then the WSJ editorial page was flogging Dow 36,000 and telling readers that anyone who had doubts about the level of stock prices must hate capitalism.
Beyond that, there are some real differences between the Bush and Clinton bubbles.
One is that Bush presided over only four years of job growth, 2003-2007 — and those were all bubble-driven years. Clinton presided over eight years of job growth, with job growth at roughly equal rates in the first and second halves of that eight-year period, and the Internet bubble inflated only in the second half.
Another difference, which is really crucial, involves the debt implications. Here’s non financial debt, public plus private, as a percentage of GDP.

Have a look at those years of debt growth and which Presidencies they are associated with. 

One of the arguments that I find most interesting about the growth of debt, beyond the significance of financial liberalisation, is the clear association of increasing debt with income stagnation.

During a period of income stagnation households increase their level of debt to maintain their living standards or to keep up with new consumption norms (often based on the consumption patterns of those on upper income levels).

Another interesting argument is that higher inequality might, therefore, be an important factor in creating the conditions for financial crises.

Michael Kumhof and Romain Rancière in Finance and Development argue that
Long periods of unequal incomes spur borrowing from the rich, increasing the risk of major economic crises.
The United States experienced two major economic crises over the past 100 years—the Great Depression of 1929 and the Great Recession of 2007. Income inequality may have played a role in the origins of both. We say this because there are two remarkable similarities between the eras preceding these crises: a sharp increase in income inequality and a sharp increase in household debt–to-income ratios.

Kumhof and Rancière argue that there are two major policy options for governments to deal with high levels of household indebtedness.

There are two ways to reduce ratios of household debt to income.

The first is orderly debt reduction. What we have in mind here is a situation in which a crisis and large-scale defaults have become unavoidable, but policy is used to limit the collateral damage to the real economy, thereby leading to a smaller contraction in real economic activity. Because this implies a much smaller reduction in incomes for any given default on loans, it reduces debt-to-income ratios much more powerfully than a disorderly default. Still, a long-lasting trend toward higher debt-to-income ratios resumes immediately after the debt reduction, because workers continue to have a reduced share of the economy’s income.
The second possibility, illustrated in Chart 4, is a restoration of workers’ earnings—for example, by strengthening collective bargaining rights—which allows them to work their way out of debt over time. This is assumed to head off a crisis event. In this case, debt-to-income ratios drop immediately because of higher incomes rather than less debt. More important, the risk of leverage and ensuing crisis immediately starts to decrease.

Any success in reducing income inequality could therefore be very useful in reducing the likelihood of future crises. But prospective policies to achieve this are fraught with difficulties. For example, downward pressure on wages is driven by powerful international forces such as competition from China, and a switch from labor to capital income taxes might drive investment to other jurisdictions. But a switch from labor income taxes to taxes on economic rents, including on land, natural resources, and financial sector rents, is not subject to the same problem. As for strengthening the bargaining power of workers, the difficulties of doing so must be weighed against the potentially disastrous consequences of further deep financial and real crises if current trends continue.
Restoring equality by redistributing income from the rich to the poor would not only please the Robin Hoods of the world, but could also help save the global economy from another major crisis.
It certainly makes intuitive sense, irrespective of the economic modelling.  Mix easier access to credit with stagnating incomes and a culture of conspicuous consumption and you have a major factor in why the developed world is in crisis at the moment.

It also returns to my long-standing point that Australia's greatest generally unremarked vulnerability is our vulnerability to rising inequality. 


Inequality, not just poverty, does matter, and research like that above makes clear that it presents real dangers to economies as well as societies.


Sunday, February 5, 2012

China and the Australian Dollar

The high Australian dollar is a source of joy for many Australians, especially those travelling overseas or buying goods overseas via the Internet. To be honest, I dig it in a big way. I get that lovely feeling of schadenfreude every time some British person complains about how expensive everything is here in Australia and I love buying books from the UK's Book Depository at reduced rates with no shipping costs and an inflated exchange rate.

(Nevertheless try as I might I couldn't buy the running shoes I wanted from the US either because the stores didn't ship to Australia or they did, but didn't have the size or style I wanted. I eventually found an Australian online store that sold shoes much cheaper [for Asic Kayano 18s about $70 cheaper than the retail outlets like Rebel and Super Amart]. For an analysis of the Internet and bricks and mortar retail see here)

But these pleasures just serve to highlight that a high dollar is a major problem for Australian (non-resource) exporting and import-competing businesses. Resource exporters aren't suffering yet, because demand remains high for the things that they export, especially coal, iron ore and gas.

As most educated Australians will understand, a high Australian dollar makes imports cheaper and exports dearer, which eventually causes many businesses, especially those with options to make things in other countries to reassess whether it is worthwhile continuing production in Australia. This is what has been happening in recent weeks with Toyota and Holden announcing job cuts and before that Bluescope Steel announcing that it was abandoning exports and cutting jobs.

Expect these announcements to become more frequent in coming months, especially given the fact that economic policy-makers in Australia seem to think that nothing can or should be done about the high dollar.

The exchange rate is a key enforcer of structural change in a resources boom. This phenomenon has been called variously 'Dutch disease", the two-, three- or multi-speed economy, and the patchwork economy.

Current concerns go beyond the banal fact that economies are always multi-speed. But right now the higher prices for Australian resources and the inflow of capital to fund investment and to take advantage of interest rate differentials between Australia and most countries with very low, zero, or effectively negative, interest rates is bolstering the Aussie. Borrowing at low interest rates and then investing in Australia with relatively high interest rates is rather attractive at the moment. Also a factor is growing foreign purchases of Australian bonds, especially by central banks and sovereign wealth funds.


According to another report in the FT, foreign ownership of Australian government securities has reached 80%.


While this makes some bond traders nervous, the real problem for Australian government bonds at the moment is a lack of supply. Still one trader argues:
this is worrying as heavy foreign ownership of government bonds can be very dangerous, particularly when this is combined with a country running a current account deficit (i.e. the country is reliant on capital inflows from abroad).
These concerns seem to be overdone - Australia's CAD is as low as it has been for some time, but I suppose things could change if China fell in a hole.

Right now, the worry is the high exchange rate's negative impact on key sectors of the economy, particularly those that employ large numbers of people and help to create a more diverse economic structure for Australia.

As I have noted many times before on this blog and elsewhere, exchange rate-induced structural economic change has a lot to do with whether the high Australian dollar is sustained over the medium term or whether it falls against our major trading partners and, especially, the US Dollar.

According to Hume in the FT, most economists expect a fall in the Aussie, but not back to its long term post float average of around 75 US cents. Instead the consensus view is that it will be supported at about the mid 90s. But at the moment Australians going overseas are doing pretty well compared to the early 2000s:
Australians planning to visit London for this summer’s Olympic Games will get bang for their buck. The Aussie, which recently hit a 27-year high of 67.96p against sterling, has appreciated by more than 80 per cent since Sydney hosted the Olympics in 2000.
Given that he is a long-term bear about China's medium-term economic prospects (increasingly becoming more short-term) Michael Pettis questions whether the Aussie should be currently so strong:
I am actually much more pessimistic about Chinese growth prospects, commodity prices, and the pace of European recovery ... but even so we would have expected that the obvious prospective problems in Europe and China should have made themselves felt in the Australian dollar. So why has it remained so strong?
The answer he suggests might have something to do with the amount of capital flowing out of China as cashed up Chinese worry about the potential for wealth destruction in China in coming years.
I just had coffee earlier in the week with one of my PKU students. He told me that he and his business-owning father are trying to take money out of the country as quickly as possible. He says it has become harder recently (I don't know why) but everyone they know is setting up businesses abroad and trying to do the same, in part, he said, so that they can get foreign passports if they ever need it. On that topic there was an interesting article last week in the New York Times:
A recent survey of 980 Chinese millionaires found that 46 percent of them were considering leaving China and another 14 percent had already emigrated or were completing the paperwork for relocating. The survey by the Bank of China and the Hurun Report said 40 percent of the would-be émigrés — they’re known as “migratory birds” in China — would aim for the United States, followed by Canada (37 percent), Singapore (14 percent), Europe (11 percent), Hong Kong (5 percent) and Britain (2 percent). 
The leading reasons for taking flight: better educational opportunities for their children, advanced medical treatment, worsening pollution back home (especially urban air quality) and food safety concerns. But many potential émigrés, not surprisingly, are working on a Plan B in case China’s economic growth begins to slow, widespread social unrest takes hold or the political winds begin to blow against them.

We are seeing this process most vividly in Hong Kong. In spite of a recent video showing a fight between Hong Kongers and mainlanders in the Hong Kong subway, which went viral and inspired real anger and mutual recriminations among even some of my most laidback Beijing and Hong Kong friends, mainlanders are scooping up apartments in Hong Kong. This is from an article in Saturday’s South China Morning Post:
Data compiled by Midland Realty shows individual mainlanders spent HK$62.3 billion on residential properties in Hong Kong last year, or about 20 per cent of the value of all sales excluding those involving corporate buyers. That was almost double the 10.8 per cent in 2010. The agency expects the figure to jump to about 25 per cent this year.
Rich mainlanders are clearly eager to take money out of the country. And what is just as clear, the debate on the limits of state capitalism we have been hearing and reading about a lot recently is not just of academic interest to them. According to my student, it is becoming harder and harder for non-SOEs [state-owned enterprises] to do business in China, and more necessary than ever to have friends in high places.
As an aside, for those watching the real estate market, my student also mentioned that two very large real estate projects that his father runs are having trouble selling units. He said his father has decided to sell as quickly as he can, even at very low prices, rather than wait for prices to recover.
One of the places that Chinese capital could go is, of course, Australia. which may account for the continuing strength of the Aussie:
a lot of Chinese capital is flowing into Australia. He, for example, has traveled to Australia nine times in the past year, mainly looking after business for his father, who has also been to Australia many times. The family has large investments in food, real estate and construction, and my student tells me he often arranges to meet in Sydney or Melbourne school friends of his who also happen to be in Australia for similar purposes. My guess is that at least part of the reason for a strong dollar, in spite of weakening growth expectations, may be that a lot of Chinese capital is flowing into Australia.
What would happen if growth in China slows significantly? This would probably result in a sharp drop in non-food commodity prices, which should cause much slower growth in Australia. But if a Chinese slowdown coincided with an increase in private Chinese capital outflows, it might be difficult for the Australian dollar to adjust downward sufficiently to help absorb some of the cost of the slowdown. In that case Australia might suffer low growth and an expensive currency – not a very good combination.

Let's hope that this doesn't eventuate!

Let me finish this already long post by noting that this is not an argument against the floating exchange rate, which has been overwhelmingly beneficial for Australia since the early 1980s and has helped Australia to adjust to international shocks and keep inflation in check during the boom. But let's not pretend that it doesn't have some costs that the government and the RBA will need to manage.


Thursday, February 2, 2012

Long-term Employment Trends in Queensland

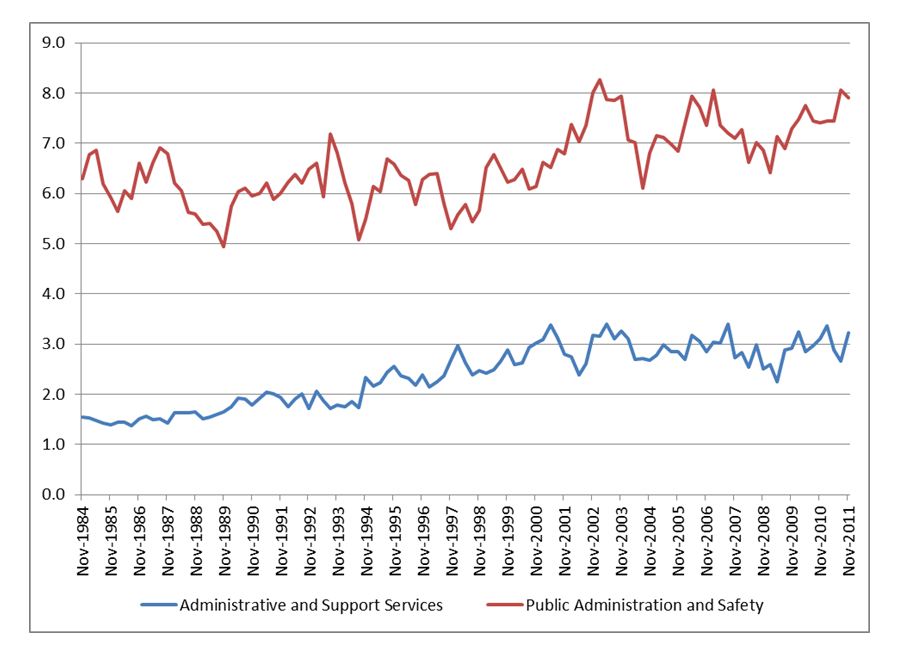
My post from the other day on employment and industry structure in Queensland contains data up to 2009-10. The following graph provides an outline of long-term employment trends by industry as a percentage of total employment, up to November 2011 (thanks to Mick Peel for pointing this out).

The percentage data and the graphics are quite revealing of the changes in Australia since 1984.

I tried putting all of the sectors on the one graph, but it looked like something Barry Jones or Kim Beazley might have designed, so I decided to separate them out for your viewing pleasure.

Remember that these graphs don't represent absolute levels of employment in the economy, just their relative importance as a percentage of total Queensland employment.  Note too that scales are different for different charts. Raw data file available on request.

Agriculture and manufacturing are big losers over this time period and remember that they had already been losing employees from well before 1984. Mining has virtually doubled in size, but still accounts for less than 4% of total employment. Construction has also grown, perhaps matching increased investment in housing and more recently in construction associated with mining and other infrastructure. That downturn in construction from 2007 to late 2011 could have been a lot worse without government assistance to the construction sector.

Wholesale and retail trade have not had the continuous decline of agriculture and manufacturing, but have done poorly in recent times, apart from an upturn for Accommodation and Food 2008-09.

It's important to remember that changes in employment may represent the decline of an industry or improvements in productivity. Those of you who grew up in the 1970s and 1980s (or before) will well remember how much more service was provided in certain retail sectors for example. Petrol stations are an obvious example, but "self serve" is a late 20th century phenomenon generally.

Professional, scientific and Technical services employment has grown rapidly since the early 1980s, while sadly education and training has remained fairly static as a percentage of the whole. I must admit that I thought that Financial and Insurance Services might have garnered a larger percentage, but this might represent the fact that Queensland jobs in finance etc might have shifted to Sydney or Melbourne.


Unsurprisingly Health Care and Social Assistance has increased significantly in recent years as have Arts and Recreation Services. Expect both of them to keep increasing their stake over coming years as the population ages and as young people increasingly "service" the recreation and health needs of cashed-up baby boomers.

Putting all the lines together reminded me of the start of that Barracudas song from the 1980s "Summer Fun". "ba ba ra ra cu cu da da"


Australia Lags World's Best Practice in Alcohol Consumption

Australians like to think of themselves as world class drinkers. Talking about getting drunk on the weekend must dominate a good percentage of workplace conversations on Monday morning (and perhaps for other mornings of the week).

I always remember my manager at the drive-in bottle-o I worked in from the time I was 18 rolling his eyes at one customer's story about how much he'd drunk the night before, before turning to me and saying "anyone would think it was hard work getting drunk, the way that guy goes on about it". Quite. Mind you he was a big drinker himself, he just didn't think it was worth going on about, probably because it was such a regular occurrence.

But I digress. It seems we are not quite as good as those former Eastern European and Soviet Communist countries. Perhaps it's all those steroids Communist bloc athletes took in the 1970s and 1980s that has given them the advantage.

The Economist has just put out a neat little graphic based on a report from the World Health Organisation, which says that we (i.e. the world) apparently drank 6.1 litres of pure alcohol per person over 15 in 2005. (That's not 6.1 litres of drinks with alcohol in them, but 6.1 litres of "pure" alcohol - the stuff you can run cars on!).

A little maths can put this in perspective. If an average stubby of beer contains 375ml and is roughly 4.5% alcohol then each beer contains 16.8 ml of alcohol or 0.0168 litres. If we then divide 6.1 by that figure we get an average global consumption of alcohol that is equivalent to 363 stubbies of beer per person per year. Using the same logic, that's 56 bottles of wine (14.5% alcohol, 750ml bottles). But this is for all adults (over 15). Given that abstaining rates are around 15%, then those who actually do drink, down a case load more.


Moldovans score the gold medal, drinking 18.2 litres each. But a closer look at the figures for Moldovans reveals that Moldovan men who do imbibe, drink over 32 litres of pure alcohol per year - close to 2000 stubbies/300 bottles of wine).

The Czechs get the silver medal with about 16 litres each.

More than half of Moldovan drinking is moonshine, which you'll know, if you've ever drunken some, ain't particularly good for your health. Illegal alcohol production supposedly accounts for almost 30% of the world alcohol consumption.

At said pub I worked at in Adelaide ("The Shandon", now "the Links" I think), it seemed to be the southern Europeans most keen to make their own alcohol. I remember having a tiny little swig of some concoction of grappa, which made me gasp for air and immediately a little unsteady on my feet, a bit like a bucket bong (at least that's what I've been told by people who've had such things).

The WHO conveniently provide country fact sheets, which are quite revealing, even if they are from 2005. Data on these things obviously takes time to collate. Perhaps it's all that drinking going on.

(For a list of country fact sheets see here)

Generally Australians are fairly happy with their consumption because it is "stable". Like in the soccer, we kick ass in the Western Pacific, beating our neighbours by almost 4 litres of pure alcohol a year per person.

But when we get rid of the "abstainers", we do even better (worse?), with males drinking 16.26 litres of pure alcohol a year (that's almost 1000 stubbies or 150 bottles of wine or some drunken combination of the two, with a few bottles of spirits thrown in).


The Australian Bureau of Statistics also collates statistics on alcohol consumption, which it calls "Apparent Consumption of Alcohol, Australia". The latest figures are from 2009-10 and reveal that:
There were 184.0 million litres of pure alcohol available for consumption from alcoholic beverages in Australia in 2009–10. This was 0.7% more than the amount available for consumption in 2008–09 (182.7 million litres).
The increase was comprised of increases from wine (up 4.3%) and spirits (up 0.7%), and decreases from beer (down 1.7%) and Ready to Drink (pre-mixed) beverages (down 1.9%).
Of all pure alcohol available for consumption in 2009–10, beer contributed 43.3%, wine 37.2%, spirits 12.5% and RTDs 7.0%.
On a per capita basis, there were 10.3 litres of pure alcohol available for consumption per person in 2009–10, which is less than in 2008–09. As a standard drink consists of 12.5 mls of pure alcohol, this is equivalent to an average of 2.2 standard drinks per day per person aged 15 years and over.
Over the past 5 years, beer is down and wine is up.


Over the longer-term this trend is even more marked.


Those guys swilling beers at 6pm in the 1960s would be deeply disappointed by all these new fangled blokes (like myself) who've almost fully switched to wine. I used to drink beer when it was really hot, now I just drink cold pinots!

My old man recalls him and his mates buying five drinks each, just before six so that they could keep drinking a little longer beyond the legislated 6pm pub closing time. The six o'clock swill indeed.

Legislation does make a difference to consumption, but not always in the ways intended. Wine is favoured in taxation terms, partly as a spur to the wine industry, but this means a higher consumption of cheap wine. And although there is some evidence that the government's increased taxation on ready-to-drink alcopops reduced young adults from 'binge' drinking, others argue that it has led to greater drinking of spirits, which are then post-mixed, rather than pre-mixed. Anecdotally, this does seem to be the case, at least amongst the small sample of young adults I know.

But while many of us like a drink, we often do tend to minimise its harmful effects.

According to "The WHO":
The harmful use of alcohol results in 2.5 million deaths each year.

320,000 young people between the age of 15 and 29 die from alcohol-related causes, resulting in 9% of all deaths in that age group.

Alcohol is the world’s third largest risk factor for disease burden; it is the leading risk factor in the Western Pacific and the Americas and the second largest in Europe.

Alcohol is associated with many serious social and developmental issues, including violence, child neglect and abuse, and absenteeism in the workplace.
But even more importantly as The WHO notes:
It also causes harm far beyond the physical and psychological health of the drinker. It harms the well-being and health of people around the drinker. An intoxicated person can harm others or put them at risk of traffic accidents or violent behaviour, or negatively affect co-workers, relatives, friends or strangers. Thus, the impact of the harmful use of alcohol reaches deep into society.
Harmful drinking is a major determinant for neuropsychiatric disorders, such as alcohol use disorders and epilepsy and other noncommunicable diseases such as cardiovascular diseases, cirrhosis of the liver and various cancers. The harmful use of alcohol is also associated with several infectious diseases like HIV/AIDS, tuberculosis and sexually transmitted infections (STIs). This is because alcohol consumption weakens the immune system and has a negative effect on patients’ adherence to antiretroviral treatment.
A significant proportion of the disease burden attributable to harmful drinking arises from unintentional and intentional injuries, including those due to road traffic accidents, violence, and suicides. Fatal injuries attributable to alcohol consumption tend to occur in relatively younger age groups.
I often wonder, given these obvious pathologies, why alcohol is legal and marijuana is illegal. Alcohol seems to be a much bigger problem and many of the problems associated with marijuana are caused more by its illegality, rather than its consumption.

For those interested in an analysis of the possible benefits of legalising marijuana, see an article by Professor Jan van Ours "The Long and Winding Road to Marijuana Legalisation" at Vox.