Monday, February 21, 2011

The Housing Debate ... once again


I was going to write a missive on the housing issue after watching a debate between the Two Ronnies of housing analysis Steve Keen and Christopher Joye. But Leith van Onselen has done it already.

The core of the debate goes to the reasons for higher prices (and lower affordability). Keen argues that it's all about debt and that eventually increased debt will bring the whole edifice tumbling down. Joye argues it's all about supply constraints - planning laws, not enough land being released etc. But as van Onselen points out:
The debate went largely as expected, with Professor Keen arguing that Australia’s housing bubble had been caused by an explosion of debt levels and lax lending by the banks, as evident by the ratio of mortgage debt to GDP having risen from around 17% of GDP in 1990 to around 90% currently on the back of a large fall in deposit requirements by the banks (from 20% pre-1990 to only 3% currently). Professor Keen also dismissed the supply/shortage argument, noting that the number of homes has grown faster than population for decades and that there is a negative correlation between population growth and house prices.
By contrast, Chris Joye argued that the Australian banking sector has been conservative with mortgage default rates that are far below comparable nations. He instead blames supply constraints for the protracted increase in house prices, noting that supply had been constrained for the past 10 to 20 years whilst housing demand had grown strongly. Joye believes the economic solution for improving affordability in the medium to longer term is “elastifying” (improving the responsiveness of) the supply-side of the housing market.
I must admit that I found the debate incredibly frustrating. Why is it that commentators on the Australian housing market cannot acknowledge that both demand-side factors, like easy credit and speculation, as well as constrained supply have each played a role in creating Australia’s housing bubble? In my view, credit availability and planning/land-use constraints are equally responsible and cannot be viewed in isolation – one factor influences the other. I would even go as far as to say that housing bubbles are highly unlikely to occur unless both easy credit and supply constraints (whether from regulatory or physical barriers) are present.
When land supply is abundant and free of regulatory constraints, such as exclusionary zoning and urban growth boundaries, low-cost housing is able to be built quickly and efficiently whenever demand rises from increased credit. The fast supply response prevents prices from rising dramatically, which also reduces speculative intent, since there is little prospect of achieving strong capital gains. And with house prices remaining steady, you are also less likely to experience ‘panic buying’ from first home buyers
... 
As long as commentators focus solely on the demand-side or the supply-side of the housing market, they will never fully understand the drivers of housing bubbles and busts. The resulting incorrect diagnosis will inevitably lead to poor policy prescriptions and outcomes. Clearly, both sides of the equation are important and each influences the other.
By all means, let’s crack down on the destructive speculation and easy credit that has fuelled Australia’s housing bubble. At the same time, let’s work to free-up the supply-side barriers that have enabled the credit-fuelled demand to feed into skyrocketing house prices. Only then will Australia achieve ‘housing nirvana’.
Put Leith and the others on the MacroBusiness Super blog on your feed reader and get a view not driven by the special interests of the mainstream media.


Monday, February 7, 2011

Comparing Tariff Reform with Climate Change Reform

In today's Crikey! Bernard Keane ("What Real reform Looks Like") has a very interesting piece on comparisons between tariff reform in 1991 and the reform needed to get a carbon price in the Australian economy. While I have some sympathy for Keane's views I think he underestimates the fundamentally different political situations prevailing in 1991 and 2011.
The Prime Minister’s comment yesterday extolling the “various elements of the Carbon Pollution Reduction Scheme” when asked about handouts to industries under a carbon price demonstrates that Labor remains committed to a political solution to climate change, not an economic one.
Only a few seconds earlier in that interview (on what is consistently the most substantial political interview program, Meet The Press), Gillard had referred, as she frequently does, to the reform courage of the Hawke and Keating Governments on floating the dollar and tariff cuts.
So let’s call the PM on that and do a comparison.
The Hawke government’s Building a Competitive Australia package, which slashed tariffs across manufacturing, would have to be one of the gutsiest reform decisions ever made by a federal government (even braver, for example, than John Howard’s finest moment, the gun laws). While union opposition mainly came from the Left in Labor (Andrew Leigh wrote a good account a while back) and the corporate sector was divided on protectionism, it was while a savage recession as still unfolding. When Hawke rose to deliver the package in Parliament in March 1991, unemployment was nearly 9% and rising.
Like carbon pricing, much of the debate over how far Australia should go in reducing tariffs was couched in terms of how our trade-exposed industries would fare when we started reducing protection and other countries did not. But the Hawke Government, recognizing the need to complete the opening of the Australian economy they had commenced in the 1980s, decided, on the advice of figures like Ross Garnaut, to adopt a unilateral approach to reform.
What “industry adjustment” assistance did our trade-exposed industries receive as part of the Building a Competitive Australia package? They got nothing. Hawke, Button and Keating put $90 million into a package for displaced workers to help retrain them and move them to other industries. There was also a rural adjustment package and increased services and loans for exporters. Otherwise, the big manufacturers got nothing.
And of course they got nothing. That was the very point of the reform.
The CPRS, in which the Prime Minister says “a lot of good work was done, contained so much industry assistance - — $20 billion over a decade — that it initially cost the Budget money. Far from being any sort of “great big new tax”, for the first five years of operation the CPRS would have cost the Budget a total of $4 billion. The CPRS wouldn’t have provided a net return to the Budget — ie: been any sort of tax, great, bit, new or otherwise, until the 2020s.
Most of the recipients of the industry assistance would have been foreign multinationals. Rio Tinto was largest, followed by Alcoa. BP, Shell, Norsk Hydro, Chevron, Mobil were all big recipients of free permits. Only local steel makers Bluescope and OneSteel and CSR figured among the top ten beneficiaries. None are major employers.
As the Grattan Institute subsequently showed, the exorbitant levels of assistance were far in excess of the actual level of actual impact of the CPRS on the most trade-exposed companies.
It’s appalling that the CPRS provided massive handouts to a number of the world’s biggest companies. It was indeed “good work” if you were a shareholder in Alcoa or Shell. But that’s a moral issue, not a policy issue. If the exorbitant handouts had no impact on the goals of the CPRS, or even facilitated them, there would have been a case for the CPRS.
Instead, by muting nearly the entire carbon price signal for our biggest polluters, the CPRS would have created an incentive for them to maintain business-as-usual at least until the 2020s, when the handouts were scheduled to start winding down — assuming the then-government was prepared to let them do so. It would have transferred the task of reducing emissions to the domestic economy and the power sector, which had its own set of less generous handouts.
Labor figures acknowledge the CPRS turned into a rentseekers’ frolic, with each government backdown encouraging more executives to book a flight to Canberra to wave rubbish modeling and warn of massive job losses, production cuts and the four horsemen of the Apocalypse. Australian innovation at its finest.
Nonetheless, despite the campaign waged by it all sides, Labor’s CPRS remained popular with voters right up until its axing last May. As far as voters were concerned, they wanted action on climate change, and the CPRS, which they didn’t have the faintest understanding of, ticked the box. After all, if Malcolm Turnbull was prepared to sacrifice his leadership for it, it must be OK.
Labor’s primary goal remains to convince voters it is taking action on climate change. Whether that action is effective is less important. That’s why they want to keep the handouts, and why there is going to be a fight with the Greens over them.
Thank goodness Hawke, Keating and Button were smarter than this lot.


Here is my response:

Bernard,

Thank you for your article. I've been thinking about this issue for a number of years and now that I have some study leave have been thinking about writing an academic article on the comparison between these two key reforms. I'm glad that someone in the media has finally seriously tackled the comparison, which is extremely pertinent for Australia's economic future.

There is no doubt that the 1991 package was a gutsy reform (I wrote about it as part of an article called "The Domestic Politics of Globalisation" in the Australian J of Political Sci) and I think the package was a major nail in coffin of the entire protectionist policy edifice in Australia. But the 1991 package was an important step in a long period of reform. The 1988 tariff cuts prepared the way, even though as you say the economic situation as remarkably different. By 1991, the Labor government had also built a coalition in support of tariff reform and had spent the previous eight years persuading and coercing Australians that such changes were inevitable.

There were still some sceptics in the business sector, but the battle of ideas had been won. Even the Metal Trades Industry Association accepted the inevitability of tariff reform. This is not the case with a carbon price. The government doesn’t have the same level of ‘business’ support.

Even the union leadership didn't argue too hard against the 1991 package with Martin Ferguson describing it as "sweet and sour". Labor also had an opposition arguing for harder and faster on the liberalisation front and key business sectors were effusive in their praise.

Importantly, much of the serious media were supportive. Leftist traditional Labor voters had nowhere to go but to vote Democrat or some other minor party, before they effectively preferenced Labor anyway.

Making a comparison, therefore, between this reform and the carbon price reform needs to acknowledge clearly the fundamentally different political situation facing the Rudd and Gillard governments: an opposition clearly opposed, a new government extremely uncertain about reform, a voting base with somewhere else to go, a media mainly opposed to acting before the rest of the world, key business sectors willing to fight the government in the media.

In both cases Labor has had to deal with a sceptical voting public. Especially important for Labor are the blue-collar (self-employed) voters many of whom were never convinced of tariff reform, perhaps still aren't. These can be opposed to another key section of Labor's constituency, the 'flat white' drinking, university educated voters who rightly saw an inevitability about the need for adaptation of the Australian economy and who no longer saw tariff protection as a panacea for dealing with Australian economic vulnerabilities. I imagine broadly that these two groups continue to divide over the issue of a carbon price and the broader issue of climate change and environmental protection. It’s important to remember the eventual political outcome for Labor was John Howard’s ascendancy, which was built upon garnering a large number of conservative former Labor-aligned voters.

It's also incorrect to argue that there was no adjustment assistance in the transition to lower tariffs. Labor's industry policies under Button were fundamentally about adjustment and we are still paying adjustment cash to two key industries, whose decline was managed by Labor in the 1980s and 1990s - cars and textiles, clothing and footwear. Big manufacturing in the form of the car majors and some minors got a lot and are still getting a lot!

I don't disagree, however, that the whole carbon price exercise has been one big exercise in rent-seeking and the level of compensation probably meant that not getting the CPRS was probably a good thing. This process is also why I prefer a simple carbon tax, the proceeds of which could be hypothecated into renewable energy research. And I mean research and not subsidisation of existing inefficient renewable technologies such as the ridiculous schemes to pay people to put up solar panels.

Best,
Tom


Sunday, February 6, 2011

The Australian Economy: A Deficit of Long-Term Thinking?

The flood levy has caused most of the usual suspects on debts and deficits to come out and spruke their position, whether it's "increasing taxes is always bad" or "deficits are not really a problem for Australia". While my sympathies definitely lie with the latter rather than the former, I can't help but feel that we should have been building a rather large fiscal surplus over the past 20 years 'without a recession'.


While going into deficit was a necessary move by the Rudd government, the real question is whether the fiscal balance should have been in better shape before the crisis, given the mining boom and the long period of growth before the global financial crisis (GFC). Given Australia's recovery from the downturn and the increase in export prices the Gillard government certainly should be aiming to get a large surplus together sooner rather than later.

Being critical of the pro-deficit position is not an argument for less infrastructure spending, but for increased tax on super profits, especially in the mining sector, but perhaps also in the banking sector. Remember that Australia's mineral resources (whether you think we should be mining them or not) are non-renewable. Once they're gone, they're gone forever. They should be seen as the property of future generations as well as the present generation of Australians. Using taxes from mining profits to build infrastructure or to fund research into renewable energy sources makes sense on an inter-generational basis and would contribute to higher standards of living across the Australian population now and into the future.

If we look at GDP growth since the early 1990s it makes it even clearer that we should have built up a big surplus over time.


There have been only three crosses into contraction since the recovery from the early 1990s recession. This is a remarkable turnaround from the situation between 1974 and 1992 when we had three recessions and 2 other downturns. Australia has had a remarkable turnaround since the early 1990s from the seemingly terminal decline of the 1970s and 1980s.

The reasonable fiscal position of the federal government in 2008-09 made a big difference for Australia's ability to ride out the GFC and more importantly not suffer the public debt problems that the Europeans and Americans are now faced with.

But let's not forget the continuing problem of private debt in Australia. As the following graphs clearly show, Australia remains vulnerable to changes in international financial supply.


After a little dip during the GFC, Australians have returned to the unprecedented debt levels of 2007-08. The question that always need to be asked is just how high can debt go? The answer will have a lot to do with external conditions. In an expanding global economy with Asian flourishing, many Australians could probably push their debt out even further. But if this occurs a day of reckoning will eventually come. A growth slowdown in Asia because of a political shock or just the effects of boom and bust may slow growth in Australia causing rising unemployment, more defaults on debts and so on.

The other issue is the graph on the right, which shows the percentage of annual income paid in interest. Now if the Reserve Bank of Australia (RBA) were to increase interest rates because of inflationary fears and you can bet they will if there is even the faintest whiff of price pressure, the pressure on household finances will increase proportionally. The pain of Queensland households has helped to reduce the pain of households in the rest of Australia.
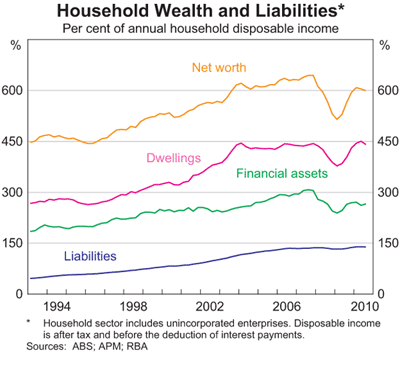
As the following graph shows, household net worth went down considerably during the GFC, while liabilities stayed relatively flat. While dwellings wealth has recovered financial assets have quite a deal to go before they get to pre-crisis levels.


The safe path would be for governments to encourage gradual deleveraging of households (and the private economy in general). Also important is a decreased reliance on foreign funding, perhaps through an increase in the super levy to 12 per cent as mooted in the Rudd government's aborted 2010 tax plans.

If we turn to inflation we can see why the RBA believes that price pressures almost got away from them before the GFC and why it now has a bias towards tightening. As the RBA governor said recently it's been rare that the RBA believes that it tightened too soon.


The high Australian dollar has also helped things on the inflation front. The following graph shows tradable and non-tradables inflation. Tradeables are those goods and services which can be exported or imported, while non tradables are not subject to export competition).


Tradable inflation has helped to keep overall inflation much lower and a higher exchange rate helps this as it makes the costs of imports lower.

There is no doubt that the Australian economy has performed remarkably since the early 1990s. This amazing overall performance (it's important to remember that not everyone has benefited) has been accentuated by the fact that the economy came through the GFC with little long-lasting damage when compared to most of Europe and the United States.

The following graphs on commodity prices make it entirely clear just how big a boost resource exports have given the Australian economy. Base metal prices have done well, but have some way to go before they match their peak, while rural goods have surpassed their previous highs.


Australia's two biggest exports iron ore and coal have increased enormously in value since a long period of stasis before 2000. China's increased steel use has been very good for Australia, but just how long prices can stay at these levels must be exercising the minds of miners in Australia. It should also be a subject of considerable concern for government in Australia given the 'untaxed' super-profits being made by our majority foreign-owned mining sector.


Overall, however, commodity prices have matched their previous peak before the GFC and as the terms of trade shows are now approaching the post-war high associated with wool demand created by the Korean War.

The terms of trade is an index-measure ratio of the average price level of exports to the average price level of imports. It effectively reflects the capacity of a given quantity of exports to pay for a given quantity of imports, and provides an important indication of the strengths and weaknesses of the economic structure. A rising or falling terms of trade indicates the possibility of improving or declining living standards, because if what we sell earns relatively more than what we buy, we will be relatively wealthier. Because the terms of trade is a ratio, increases can be a result of export prices increasing at a greater rate than import prices, or export prices increasing while import prices are declining, or export prices declining at a slower rate than import prices. Of course, a rising terms of trade doesn’t stop us from buying more things than we sell, which we have made a habit of for much of our history! Improvements in the terms of trade are not reflected in GDP figures, but improvements do contribute significantly to increases in national disposable income.

One thing that studying history has helped reinforce in my head is that good times don't last forever and that the history of the Australian economy is a history of boom and bust as the graph of the terms of trade makes clear. From the peak of 1950 until the late 1990s the terms of trade had been on a 50 year downward trend. It would be extremely optimistic to believe that we began a 50 year upward trend 10 years ago. But maybe I'm just being too negative!

All graphs from the RBA Chart Pack

Thursday, February 3, 2011

Latest Data on the World Economy

The Reserve Bank of Australia provides a monthly snapshot of the world and Australian economies through its Chart Pack. As I've argued before there really is no better source of graphical insight into the Australian economy. Unfortunately, they won't release the raw data for some of the graphs because some of the data is subject to copyright.


This first one shows the recent downturn in world growth and why Australia has done relatively better than the rest of the world. Compared to the world as a whole, Australia's trading partners have recovered more rapidly, with China and India (and the rest of Asia) doing far better than the Europe (with the exception of Germany) and North America.  But it also shows just how severe the drop in growth was at the bottom of the recession and how government action made such a big difference. Paying off some of that govt action, however, will make a difference to GDP growth with the UK's recent economic contraction an indicator of possibilities elsewhere of retrenchment. The US of course has eschewed such hairshirt policies and the graphs below on unemployment and inflation in the US provide some indication as to why this is the case.

This second graph shows just how severe the recession was in Japan, the United States and Euro area. The contraction was most severe in Japan, but it has recovered better.

Compare this to the Chinese and Indian experiences of the global recession. Note there was no slip into negative territory although some commentators argue that anything below 5-6 per cent growth in China might feel like a recession!! For an interesting take on Chinese GDP figures, have a read of Michael Pettis's recent blog piece.


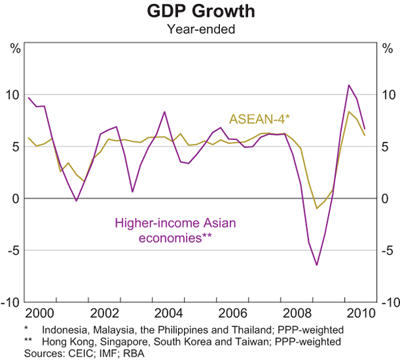
The rest of Asia did not do quite so well, but it shows why many commentators are arguing that Asia had a good global recession and why many people now think the 21st century will be dominated by Asia.


There is also a big debate going on about inflation pressures and many worry that monetary authorities (especially in the US and Europe) are not taking them seriously enough. Many of these same commentators don't seem to be too concerned about unemployment partly because they get extremely worried when labour markets tighten up (as they are in Australia). But the next two graphs show that at the moment unemployment should be the major concern of policy-makers in the US and Europe. Inflation obviously isn't the problem in Japan! Japan's issue is deflation. But falling prices might not be the good thing that your grandma might imagine. Just imagine her saying "things used to be so much cheaper when I was young". To crudely understand why this is a problem, think about why you would buy something today when it will be cheaper tomorrow.


The graph on unemployment should make us realise just how good a global recession we've had in Australia compared to the United States. With the amount of building work to be done to deal with natural disasters, it's unlikely that aggregate unemployment is going to be a major concern in Australia. No doubt, however, there are more concerns when we disaggregate the labour market and start to think about skills development and training etc.

Inflation, however, is a problem for China and India and efforts to deal with it could have an impact on Australia.

The next graphs shows the impact of Chinese government efforts to bolster the economy during the downturn. The year-ended growth figures are truly astounding as was the growth in credit. Although credit growth has declined, note what it has declined to!! It 'only' grew by around 20 per cent during 2010!


What does all this mean? Well for one thing how the Chinese government handles inflation and the growth in the Chinese property market are going to have large implications not only for Australia, but for the rest of Asia and, indeed, the whole world.