Sunday, November 29, 2009

China and America: Global Imbalances and Decoupling Yet Again

An interesting point made by Tyler Cowen (Dangers of an Overheated China) about the US-China economic relationship.
PRESIDENT OBAMA’S recent trip to China reflects a symbiotic relationship at the heart of the global economy: China uses American spending power to enlarge its private sector, while America uses Chinese lending power to expand its public sector. Yet this arrangement may unravel in a dangerous way, and if it does, the most likely culprit will be Chinese economic overcapacity.
This captures in a neat way the substance of the current relationships and the dangers as well. The US economy is still in a bad way. If you're in any doubt about this have a read of Gretchen Morgenson (Get Ready for Half a Recovery). Once again the issue comes back to the global imbalances (Chinese current account surpluses versus US deficits) and decoupling (or not).

Cowen might be alarmist in his concerns about overcapacity but it seems that there is substantial evidence to back the overcapacity case up. Chinese banks have kept on lending and Chinese companies have kept on producing but who's buying this extended production?
China has been building factories and production capacity in virtually every sector of its economy, but it’s not clear that the latest round of investments will be profitable anytime soon. Automobiles, steel, semiconductors, cement, aluminum and real estate all show signs of too much capacity. In Shanghai, the central business district appears to have high vacancy rates, yet building continues.
Chinese planners now talk of the need to restrict investment in sectors that are overflowing with unsold products. The global market is no longer strong, and domestic demand was never enough in the first place.
Regional officials have an incentive to prop up local enterprises and production statistics, even if that means supporting projects or accounting practices that are not sustainable. For an individual business, the standard way to get more capital resources is to put forward a plan for growth. Because few sectors are mature, and growth has been so widespread, everyone can promise to be profitable in the future.

 
Can China keep on growing without final demand, particularly from the US? There's a lot at stake for Australia as well. China has kept on buying those resources throughout the global recession but eventually it has to sell things to keep buying our resources.

Chinese production is now helping to fund US deficits, which in turn is keeping the US economy afloat. The hope is that the US fiscal stimulus kick starts the US economy, which keeps Chinese factories rolling over, which allows Australian miners to keep selling minerals to China.

It could all work out, but then again it might not.

Cowen outlines perhaps the worst contingency:
China has had a 30-year run of stellar economic growth. But it’s only human nature for such expansion to breed too much optimism, overextending an entire economy. Americans have found this out the hard way in their own financial crisis.
History has shown that no major economy has grown into maturity without bubbles, crises and possibly even civil strife or civil wars along the way. Is China exempt from this broader pattern?
The notions of excess capacity and malinvestment were common in business-cycle theory of the 19th and early 20th centuries, when growing Western economies had frequent crashes of this kind. Numerous writers, from the Rev. Thomas Malthus to the Austrian economist Friedrich A. von Hayek, warned about the overextension of unprofitable capital deployments and the pain from the inevitable crashes. These writers may well end up being a guide for understanding China today.
What will the consequences be for the United States if and when the Chinese economic miracle encounters a major stumble? A lot of Chinese business ventures will stop being profitable, and layoffs and unrest will most likely rise. The Chinese government may crack down further on dissent. The Chinese public may wonder whether its future lies with capitalism after all, and foreign investors in China will become more nervous.
In economic terms, the prices of Chinese exports will probably fall, as overextended businesses compete to justify their capital investments and recoup their losses. American businesses will find it harder to compete with Chinese companies, and there will be deflationary pressures in both countries. And even if the Chinese are selling more at lower prices, they may be taking in less money over all, so they may have less to lend to the United States government.
In any case, China may end up using more of its reserve funds to address domestic problems or placate domestic interest groups. The United States will face higher borrowing costs, and its fiscal position may very quickly become unsustainable.


Friday, November 27, 2009

Tax burdens and the Role of Government

One of the major arguments of economic liberals in the 1990s was that globalisation would force a reduction in the size of the state. I was always sceptical about such claims given that the evidence seemed to go in the opposite direction when considering the fact that small trade exposed developed economies often had high taxation and extensive welfare states.

The latest OECD figures show that tax revenue declined (very) slightly in 2008 but this is not surprising given the economic downturn. Over the previous 30 years or so, as the world has become more globalised, tax revenue as a percentage of GDP has increased.

The figures for 2007 and 2008 make interesting reading showing that Australia is generally a low tax economy.


The welfare state has been remarkably resilient. This should not necessarily be surprising because the association of openness with the growth of the state has a long and varied intellectual pedigree. In a study of 18 capitalist economies in the 1970s, Cameron (1978) argued that “a high degree of trade dependence is conducive to a relatively large expansion of the public economy” and, further, that “a strong positive correlation … exists between the size of the increase in the public economy and a measure of economic equality”. In the mid-1980s, Katzenstein (1985) pointed out that in the ‘neo-corporatist’ countries of Western Europe strong social democratic parties and powerful union movements had led to a strategy of social compensation and had underpinned openness and competitiveness. Openness did not lead to, nor did it require, a small state or increased inequality. Indeed, in the late 1980s, Castles argued that “democratic capitalism is necessarily and unavoidably the progenitor of big government”.


Into the 1990s, many argued that while these views may have once been relevant, globalisation had made them redundant. This pessimistic view, however, has increasingly come up against the evidence. Garrett pointed out that partisanship continued to shape public spending, sound macroeconomic outcomes and higher levels of equality through the 1980s and early 1990s. Weiss argued that the idea of the powerless state was “a myth” and Rodrik reconfirmed and extended Cameron’s thesis, with a study of more than a 100 countries, contending that there is “a robust association between an economy’s exposure to foreign trade and the size of its government”. He concluded, “government expenditures have been and continue to be essential to provide social insurance against external risk”. Garrett criticised the static correlations of Cameron, Rodrik and others, arguing that it was necessary to consider changes in the level of globalisation over time and to analyse the impact of financial globalisation as well as trade. He found that increased trade globalisation over time had led to slower growth in government spending, but that higher levels of capital mobility had no effect on government spending. Responding to the need for a dynamic analysis of changes in the level of globalisation, Cameron and Kim considered changes in a country’s level of trade. They found that the total level of trade was insignificant for year-to-year changes in the relative size of government. Large increases in the volume of trade were associated with only small increases in the level of government taxing and spending, but large and deteriorating trade deficits “exerted a significant expansionary impulse on government spending across the advanced capitalist world”. Dreher, Sturm and Ursprung investigated globalisation’s impact on the composition of government spending in a sample of 60 countries between 1971 and 2001 and the OECD since 1990. They conclude rather prosaically, “our results indicate that none of the investigated expenditure categories has been robustly affected by any of our globalisation indicators”. This, they argue, is because governments match the disciplining effects of globalisation with compensatory spending, or “the effects of globalisation might be exaggerated in the popular discussion and might simply not exist”.

Colin Clark predicted in 1945 “that about 25 per cent of the national income, or possibly rather less” was “the critical limit of taxation”. Subsequent developments proved Clark wrong as some countries in Europe went well over 50 per cent of GDP. Whether there is an upper limit for capitalism around the levels reached by Scandinavian countries in the 1990s remains to be seen. While the ever-expanding state may have been slowed or even halted in some cases and while welfare institutions have been reshaped to bolster productivity, social spending remains pivotal in the first decade of the twenty-first century. As Cameron and Kim summarise, “the fiscal role of the government remains significant in all [countries] and continues to increase in some”. What is considered to be the appropriate limit of state spending continues to vary throughout the world, based on a combination of partisanship, political institutions, historical legacies, culture and ideology. Changes to outcomes and the composition of spending need to be analysed on a comparative or individual basis to understand how states have adapted to the pressures from the international and domestic domains. Although there are subtle but important differences in the various studies of the relationship between globalisation, taxing and spending, their broad thrust is that the retrenchment predicted has not happened. This is particularly the case in the advanced capitalist countries and is true for both welfare and general government spending. Leibfried and Rieger turn traditional arguments about the limits of the welfare state by arguing that there are limits to globalisation. They contend, “Just as government freedom of action is dependent on ‘globalisation’, the fate of globalisation itself is decided by government action”. Although it was not planned, the welfare state was a vital precondition for post-war globalisation. Instead, it was “an ironic twist of world history”. On this basis, it is possible to surmise that into the future liberal democratic support for globalisation may depend on redistribution.

Globalisation does not mean the end for the state as the financial crisis has made clear; rather, states have developed new ways to govern and generate economic growth. The coming years will provide new challenges for the state as it attempts to deal with a changing set of pressures from the world economy, interest groups and the electoral process. Gourevitch’s prescient plea for the continuing importance of politics, during the turmoil of the 1970s, is just as relevant today:

However compelling external pressures may be, they are unlikely to be fully determining, save for the case of outright occupation. Some leeway of response to pressure is always possible, at least conceptually. The choice of response therefore requires explanation. Such an explanation necessarily entails an examination of politics; the struggle among competing responses. The interpenetrated quality of international relations and domestic politics seems as old as the existence of states.
Constraints on states are now as intense as they have ever been, but not in the sense that state declinists would argue. Instead, the interaction of global and domestic pressures squeezes governments ever more intensely. Anyone trying to understand the role of government in the 2000s must come to grips with this more elaborate structure of constraints and opportunities and move beyond banal assertions that globalisation weakens the state.


References:

David Cameron (1978) “The Expansion of the Public Economy”, American Political Science Review, 72(4), pp. 1253 & 1258.


Peter Katzenstein (1985) Small States in World Markets.

Francis Castles (1988) Australian Public Policy and Economic Vulnerability, Sydney, Allen & Unwin, 1988, p 2.
William Greider (1997) One World, Ready or Not: The Manic Logic of Global Capitalism, New York, Simon and Schuster.

Philip G. Cerny (1997) “Paradoxes of the Competition State: The Dynamics of Political Globalization”, Government and Opposition, 32(2), pp. 251-74;

Susan Strange (1996) The Retreat of the State.

Robert O. Keohane and Helen V. Milner (eds) (1996) Internationalization and Domestic Politics, New York, Cambridge University Press.

Geoffrey Garrett (1998) Partisan Politics in the Global Economy, Cambridge, Cambridge University Press.

Linda Weiss (1998) The Myth of the Powerless State: Governing the Economy in a Global Era, Cambridge, Polity Press.

Dani Rodrik (1998) “Why Do More Open Economies Have Bigger Governments?”, The Journal of Political Economy, 106(5), p. 997.

Adrian Wood (1994) North-South Trade, Employment and Inequality, Oxford, Oxford University Press;

Dennis Quinn (1997) “The Correlates of Changes in International Financial Regulation”, American Political Science Review, 91(3), pp. 531-51.

Geoffrey Garrett (2001) “Globalization and Government Spending Around the World”, Studies in Comparative International Development, 35(4), pp. 3-29.

David R. Cameron and Soo Yeon Kim (2006) “Trade, Political Institutions and the Size of Government” in David R. Cameron et al (eds) Globalization and National Self-Determination: Is the Nation-State Under Siege?, London and New York, Routledge, p. 43.

Axel Dreher, Jan-Egbert Sturm, Heinrich W. Ursprung (2008) “The Impact of Globalization on the Composition of Government Expenditures: Evidence from Panel Data, Public Choice, 134(3-4), pp. 262-93.

Colin Clark (1945) “Public Finance and Changes in the Value of Money”, The Economic Journal, 55(220), p. 376.

Elmar Rieger and Stephan Liebfried (2003) Limits to Globalization, Cambridge, Polity Press, p. 4.

Michael Keating (2004) Who Rules: How Government Retains Control of a Privatised Economy, Sydney, Federation Press.

Peter Gourevitch (1978) “The Second Image Reversed: The International Sources of Domestic Politics”, International Organization, 32(4), p. 911.

Linda Weiss (2003) “Is the State Being ‘Transformed’ by Globalisation” in Linda Weiss (ed.) States in the Global Economy: Bringing Domestic Institutions Back In, Cambridge, Cambridge University Press.

Thursday, November 26, 2009

Foreign Investment

The big story of foreign investment in the last couple of years has been China.
Although Japanese investment has increased considerably over the past year as well, we stopped worrying about Japan in the 1990s.

Given these facts it is quite interesting that in the most recent release of 5352.0 - International Investment Position, Australia: Supplementary Statistics, 2008 shows that direct Chinese investment was still minimal up to the end of 2008 (the end of the period under review).

While Australia trades heavily with East Asia our investment links are poor.

When considering foreign investment statistics we need to distinguish between stocks and flows. Stocks are the accumulated investments over time measured at a particular point in time and flows (or transactions) register investment over a time period (in this case one year, 2008)

According to the ABS Australia’s net international investment position at the end of 2008 "was a liability of $713.8 billion, an increase of $58.7 billion on the previous year."
The breakdown for FOREIGN INVESTMENT IN AUSTRALIA was:
The level of foreign investment in Australia increased by $66.9 billion to reach $1,724.4 billion at 31 December 2008. Portfolio investment accounted for $921.2 billion (53%), direct investment for $392.9 billion (23%), other investment liabilities for $302.6 billion (18%) and financial derivatives for $107.8 billion (6%). Of the portfolio investment liabilities, debt securities accounted for $689.1 billion (40%) and equity securities for $232.1 billion (13%).
The leading investor countries at 31 December 2008 were:
United Kingdom ($427.1 billion or 25%)
United States of America ($418.4 billion or 24%)
Japan ($89.5 billion or 5%)
Hong Kong (SAR of China) ($56.3 billion or 3%)
Singapore ($43.1 billion or 2%)
Switzerland ($38.1 billion or 2%)
In addition, the level of borrowing raised on international capital markets (e.g. Eurobonds) was $145.3 billion or 8%.
It is clear that people who speak English like investing in each others' countries. Investing in countries like China is a difficult process and many restrictions remain. It's a bit of a joke really when people suggest that the Chinese will be offended if we don't get rid of the Foreign Investment Review Board. Instead, the Chinese well understand that strategic overview of investment is a worthwhile process regardless of what the economic liberal commentariat suggest.

The breakdown for AUSTRALIAN INVESTMENT ABROAD was:
The level of Australian investment abroad reached $1010.6 billion at 31 December 2008, an increase of $8.2 billion on the previous year. Portfolio investment abroad accounted for $373.1 billion (37%), direct investment for $281.1 billion (28%), other investment for $196.1 billion (19%), reserve assets for $47.5 billion (5%) and financial derivatives for $112.9 billion (11%).


The leading destination countries as at 31 December 2008 were:

United States of America ($394.6 billion or 39%)
United Kingdom ($158.1 billion or 16%)
New Zealand ($66.1 billion or 7%)
Canada ($38.8 billion or 4%
France ($35.4 billion or 4%).
Netherlands ($30.0 billion or 3%)
Transactions (flows) over the past year still don't record the huge growth of Chinese investment (although it is likely that they will in 2009. Remember that these transactions include all types of foreign investment not just foreign direct investment (FDI) which covers investment at a level of greater than 10 per cent in a particular company.

FOREIGN INVESTMENT IN AUSTRALIA "recorded a net inflow of $149.0 billion for the year ended 31 December 2008, a decrease of $11.0 billion on the net inflow of $160.0 billion for the previous year."
The leading investor countries were:

United State of America ($27.0 billion or 28%)
United Kingdom ($25.9 billion or 17%)
Japan ($20.3 billion or 14%)
Germany ($14.6 billion or 10%)
Hong Kong ($11.4 billion or 8%)
Switzerland ($8.8 billion or 6%).
AUSTRALIAN INVESTMENT ABROAD "recorded a net outflow of $100.8 billion for the year ended 31 December 2008, an increase of $6.6 billion on the net outflow of $94.1 billion for the previous year."
The leading destination countries were:

United States of America ($53.3 billion or 53%)
New Zealand ($14.5 billion or 14%)
Singapore ($8.0 billion or 8%)
United Kingdom ($7.4 billion or 7%)
Canada ($5.7 billion or 6%)
Luxembourg ($3.6 billion or 4%)
This set of statistics also show the amount of income paid out to foreigners and received by Australians from foreign investments.

Australia has a net income deficit (which is a vital component of our current account deficit) which is not surprising given that investment in Australia has long been greater than saving in Australia.
Income debits totalled $86.7 billion for the year ended 31 December 2008. This result is up $1.2 billion on the income debits in the previous year.
The main countries to which income accrued for the year ended 31 December 2008 were:


United States of America ($18.3 billion or 21%)
United Kingdom ($13.9 billion or 16%)
Japan ($7.4 billion or 9%)
Switzerland ($5.6 billion or 7%)
Netherlands ($3.2 billion or 4%)
Hong Kong ($1.7 billion or 2%)
One of the big changes in recent years has been the significant increase in Australian investment abroad.
Income credits totalled $41.8 billion for the year ended 31 December 2008. This result is up $3.5 billion on the income credits in the previous year. The main countries from which income accrued for the year ended 31 December 2008 were:

United States of America ($14.7 billion or 35%)
New Zealand ($4.4 billion or 10%)
United Kingdom ($4.1 billion or 10%)
Canada ($3.8 billion or 9%)
Netherlands ($1.5 billion or 4%).

For a more recent catch up on capital flows in and out of Australia see Australian Capital Flows and the Financial Crisis from the Reserve Bank Bulletin written by Patrick D’Arcy and Crystal Ossolinski of the International Department.

In this article they note that between 2000 and 2007 capital flows increased significantly compared to GDP and were relatively stable. The last 18 months or so have been more chaotic. Even though Australia has done well the global financial crisis they note that it still had a huge impact on capital flows.
Not only was it difficult for borrowers to obtain funding in international markets, but many international investors repatriated existing offshore investments. In essence the crisis induced a temporary bout of ‘home bias’ among global investors.
But the decline in foreign investment in Australia was partly covered by the repatriation of investment back to Australia.

Most of the volatility was related to credit markets (bank lending and asset-backed securities) and like in the Asian financial crisis before hand FDI was unaffected. Big investments can't be quickly withdrawn and generally direct investors are in for the long haul (unless it's investment by private equity companies - but that's another story).

This interruption to credit markets was significant for Australia given that before the crisis bank lending and asset-backed securities amounted to about 8 per cent of GDP per year between 2004 and 2006 - a huge amount.

It is clear in hindsight that govt action had a beneficial effect on supporting capital flows during the crisis. These include the setting up of US dollar swap lines between the US Federal Reserve and the RBA.
Reflecting the fact that the US dollar funds available under this facility were cheaper than available in the market, particularly in the December quarter, Australian banks replaced some of their short-term foreign funding with funding through this means.
According to D’Arcy and Ossolinski capital flows returned to "their pre-crisis configuration in the first half of 2009. Reflecting the improvement in global market conditions and the introduction of the government guarantee on bank debt, offshore debt issuance by Australian banks recovered solidly over the first half of 2009." This negated the need for the swap facilities.

The decline of the Aussie dollar also encouraged capital inflow (remember that an increase in the Aussie makes investment abroad more attractive to Australians and less attractive for foreigners).

Australians have also decreased their level of equity investment outside of Australia, which means that "the composition of net capital inflows has shifted towards sizeable equity inflows. In the decade prior to the crisis there was net equity outflow."

Another impact of the crisis has been the increase in public debt (see my earlier blog for an analysis of public debt in Australia), part of which has been funded by foreigners.
Federal government debt increased by $33 billion in net terms over the first half of 2009, and around $5 billion of this was recorded as being purchased by foreign investors. However, partly offsetting this is the ongoing investment in foreign equity assets by the public sector, mainly through the Future Fund, which amounted to $2 billion over the first half of 2009.

Monday, November 23, 2009

Krugman on Stimulus, Debt and Hysteria etc

Paul Krugman has long been the most accessible economic commentator on the US scene. I've been reading his work from the early 1990s when his contrarian views were aimed at those centre-left commentators like Lester Thurow, Robert Reich and Robert Kuttner who he argued were over-estimating the impact of globalisation.

His book Pop Internationalism was a fairly savage attack on what he implied was an economically illiterate position. In those days I saw him as a bit of smarty, who set up straw man constructions of his opponents' arguments (and he really did see the debate in these oppositional terms).

But in the main, I soon realised he was largely correct about globalisation and indeed his scepticism was needed. The belief of the Clinton Liberals that they were "held hostage by a bunch of f...king bond traders" was indicative of the overblown (financial) globalisation thesis that effectively argued that finance ruled and needed to be obeyed. (Susan Strange and Philip Cerny also argued this position).

This was always crappola, especially in the US, but the lobbies were extremely powerful and US policy-makers saw a more free-wheeling approach to financial regulation as in the US's interests. Unfortunately, the fact that the Clinton admin gave so much ground to financial interests is a fundamental antecedent of the global financial crisis.

No doubt Krugman has shifted to the left since those days and perhaps today he is the most influential liberal (in the American sense) economic commentator in the US, writing regularly for the New York Times.  His blog The Conscience of a Liberal is definitely worth following if you're interested in the US or world economy.

His latest crusade is against the fear mongering about US public debt. Now US debt is extremely high at $12 trillion, but Krugman argues that the crisis was and is still so bad that this debt is worthwhile and needs to be extended.

The NYT itself ran a story on the front page about the debt quoting Bill Gross of Pimco, who argues that
What a good country or a good squirrel should be doing is stashing away nuts for the winter ... The United States is not only not saving nuts, it’s eating the ones left over from the last winter.
You got to love folksy parables about government debt. Not.

But government debt makes good copy. It is, after all, the tax payers' money. And, you'll be pleased to know that the financial sector has the taxpayers' interests at heart!

Krugman's most recent target in "The Phantom Menace" is Obama, whom he argues is losing his nerve and rationality.
In December 2008 Lawrence Summers, soon to become the administration’s highest-ranking economist, called for decisive action. “Many experts,” he warned, “believe that unemployment could reach 10 percent by the end of next year.” In the face of that prospect, he continued, “doing too little poses a greater threat than doing too much.”
Ten months later unemployment reached 10.2 percent, suggesting that despite his warning the administration hadn’t done enough to create jobs. You might have expected, then, a determination to do more.
But in a recent interview with Fox News, the president sounded diffident and nervous about his economic policy. He spoke vaguely about possible tax incentives for job creation. But “it is important though to recognize,” he went on, “that if we keep on adding to the debt, even in the midst of this recovery, that at some point, people could lose confidence in the U.S. economy in a way that could actually lead to a double-dip recession.
What? Huh?
Most economists I talk to believe that the big risk to recovery comes from the inadequacy of government efforts: the stimulus was too small, and it will fade out next year, while high unemployment is undermining both consumer and business confidence
Now, it’s politically difficult for the Obama administration to enact a full-scale second stimulus. Still, he should be trying to push through as much aid to the economy as possible. And remember, Mr. Obama has the bully pulpit; it’s his job to persuade America to do what needs to be done.
Obama, according to Krugman is getting the wrong advice from Wall Street. One wonders how much credibility is left on the Street, but I guess that money (especially when buttressed by the tax payer) can buy a lot of influence.
Ever since the Great Recession began economic analysts at some (not all) major Wall Street firms have warned that efforts to fight the slump will produce even worse economic evils. In particular, they say, never mind the current ability of the U.S. government to borrow long term at remarkably low interest rates — any day now, budget deficits will lead to a collapse in investor confidence, and rates will soar.
...
And shouldn’t we consider the source? As far as I can tell, the analysts now warning about soaring interest rates tend to be the same people who insisted, months after the Great Recession began, that the biggest threat facing the economy was inflation. And let’s not forget that Wall Street — which somehow failed to recognize the biggest housing bubble in history — has a less than stellar record at predicting market behavior.

Still, let’s grant that there is some risk that doing more about double-digit unemployment would undermine confidence in the bond markets. This risk must be set against the certainty of mass suffering if we don’t do more — and the possibility, as I said, of a collapse of confidence among ordinary workers and businesses.
And Mr. Summers was right the first time: in the face of the greatest economic catastrophe since the Great Depression, it’s much riskier to do too little than it is to do too much. It’s sad, and unfortunate, that the administration appears to have lost sight of that truth.
 Let's hope that Obama doesn't take too much advice from Wall Street or the Pentagon (but that's another story).

Wednesday, November 18, 2009

Growth in Asia and its Effect on Australia

Asia will be a long-term benefactor of Australian prosperity according to virtually all Australian economic policy-makers and commentators. Some like RBA governor Glenn Stevens and Treasury Secretary Ken Henry argue that there will be some problem associated with this ‘politics of prosperity’ but generally they do not consider it possible that either growth in Asia could slow or that demand for Australian resources could be negatively affected by increases in supply from elsewhere or technological changes. So-called ‘black swan’ events – war, terrorism, political unrest, environmental or natural catastrophe are not considered at all and I suppose that’s fair enough at one level. We can’t spend our entire lives preparing for the worst of all cases.

Probably the best coverage of the assumption that ‘Asian non-drama’ will be beneficial for Australia comes from Philip Lowe Assistant Governor (Economic) with the RBA. (See Philip Lowe (2009) “The Growth of Asia and Some Implications for Australia”, Talk to Citi Australia Inaugural Australian Investment Conference, Sydney, 19 October <http://www.rba.gov.au/Speeches/2009/sp-ag-191009.pdf>.)

Lowe begins by pointing out that Australia has done better than virtually any other developed country in the world, noting that Australia is the only country to not record a decline in exports. This good performance he argues was shaped by prescient monetary and fiscal policy, the “healthy state of the banking system” and “Australia’s trade links with Asia”.

His main concern he argues is with “medium-term structural issues”.

My central theme is that there are reasonable grounds for optimism about the prospects for the Australian economy over the decade ahead. There are a number of reasons for this, but the one that I would like to discuss today is our growing trade links with Asia.
Economic weight has shifted to Asia and because much of Asia is in a developmental mode it will require considerable resource development. When starting from a low base growth can be very rapid indeed.

Asia’s share of world GDP was only 7 per cent of GDP in 1990 (at market exchange rates, more if we use purchasing power parity – see my book Chapter 3 for explanation). This increased to around 15 per cent by 2008. Growth in East Asia has averaged 7 per cent a year during this period compared to 2 per cent for the developed world.

As far as industrial production goes Asia has done even better, especially China. In 1990 China’s share of industrial production was 2 per cent, in 2008 the figure was 13 per cent.

Lowe summarises the situation thus:

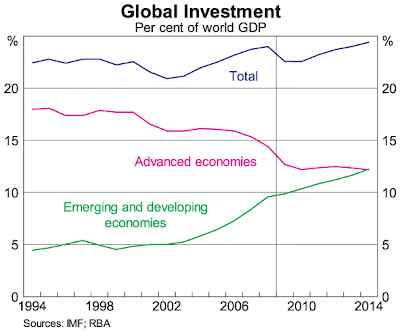
The general picture here is pretty clear: there has been very strong growth in Asia, with the economies of the region now accounting for a significant share of world output. And looking forward, there is a high probability that this will continue over the years ahead. As an illustration of the ongoing shift, recent growth projections from the IMF suggest that by 2014, the total amount of fixed asset investment in the developing world – much of which will occur in Asia – will be the same as that in the advanced economies (Graph 4). This would be a remarkable change from the situation just a decade ago when the level of investment in the developing world was only one third of that in the developed world. The change that is going on here reflects the subdued prospects for many of the advanced economies, the high pace of growth in Asia, and the current high rates of investment in many Asian countries.
Note that the assumption here is that what has happened over the past few years is expected to continue and the graph below is an estimate beyond 2008.


But the real issue here is the extent to which growth and investment in Asia is dependent on growth in the developed world. As Lowe notes demand in developed economies is likely to be weak over coming years because of the high level of indebtedness among households. (This is also true of Australia, where the debt to disposable income ratios is about 160 per cent. This is the highest ever by a long shot.). But it is not just households that are indebted, now because of the global recession governments are increasingly indebted as well. Lowe notes that: “net public-sector debt to GDP for the G7 countries is likely to exceed 90 per cent within a few years, an outcome that has not previously been seen outside of periods of war”. (See the previous post on public debt)


This takes us back to the debate about ‘decoupling’ that was seemingly won by the anti-decouplers during the financial crisis and the early stages of the global recession. Basically, the de-coupling thesis argued that Asia and Europe (but particularly China) would be less affected by events in the US economy and financial system. The anti-decouplers correctly pointed out that Asia was negatively affected by the greatest collapse of trade since the Great Depression. Indeed for a time, there seemed to be some suggestion that the export-led model was dead. European financial markets were devastated by the flow on effects of US developments (particularly the UK) and exporters like Germany were severely affected by the collapse of world trade as well. The de-couplers, however, now claim some vindication given China’s amazing growth performance built on the back of one of the biggest government stimulus packages of all time. As they say, the jury is still out. But the major question is what will happen when governments remove monetary and fiscal stimulus.

These are short-to-medium-term concerns, Lowe's main concerns are the medium-to-long-term implications of developments in Asia. He tries to navigate a middle-way in the de-coupling debate:

Slower growth in the advanced economies will inevitably weigh on growth in Asia. The business cycles of the major regions of the world are clearly interconnected, and the ups and downs in one part of the world have an effect in other parts of the world.

But importantly this is not the end of the story. These interconnections do not mean that Asia must inevitably experience a marked reduction in its medium-term growth trajectory. As we have seen recently, the region has the capability to grow strongly through domestic, not external, demand. This really should not come as a surprise.

After all, the US economy, with a few hundred million people, has grown for many decades largely on the back of domestic, rather than foreign, demand. There is no reason that the approximately 3½ billion people in Asia cannot do the same. It ultimately comes down to the policy choices that are made.
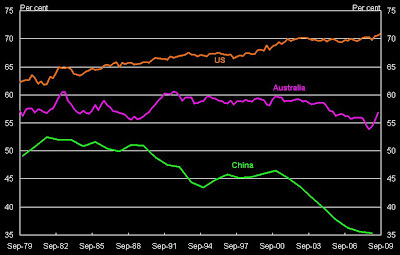
The last paragraph is a big call and consumption in Asia (China) is unlikely to match that of the West, particularly the United States, anytime soon. A chart presented by David Gruen from Treasury in a presentation entitled “Global Imbalances: How much adjustment will we see?” (at the In the Zone Conference at the University of Western Australia on 9 November 2009), shows why this is a problematic assumption.


US consumption accounts for about 18 per cent of global GDP, Chinese consumption is less than 3 per cent at market exchange rates.

Lowe acknowledges that there are long-term structural issues that need to be addressed in China and the rest of Asia for sustained increases in domestic demand to occur.


Here, there is a reasonably broad consensus as to the types of policy steps that could be made over the medium term, although the specifics clearly differ from country to country. One possibility is continuing liberalisation of the services sector, which has the potential to grow strongly in many countries in the region. Another is reform of retirement incomes policies to give people more confidence that they will have sufficient income in their old age. A third possibility is further development of the financial sector so that savings can be most efficiently allocated to those who can make best use of them.

These are all rather long-term structural issues but gradual progress on these fronts can help form the basis for sustainable growth in domestic demand over the medium term in many of the countries of the region. There is also considerable scope for high levels of infrastructure investment in many of these countries, and the process of technology convergence has much further to run. And many of the countries of Asia are devoting increasing resources to education to improve the average productivity of their workforces.
Lowe then turns to the impact on Australia and notes that our 4 biggest merchandise export markets (i.e. not including services exports such as education and travel services – the third and fifth biggest exports) are all in Asia. The graphic is particularly revealing about the rise of China’s share.


The shift towards Asia has undoubtedly been a benefit during the global recession. As Lowe acknowledges:
Despite global trade falling by nearly 20 per cent over the past year, the volume of Australian exports stayed broadly flat over this period. The strong recovery in China saw demand for raw materials rebound strongly, and Australian producers were able to respond quickly. A number of other commodity exporting countries whose major customers are in Europe and North America have, until very recently, had less favourable experiences.
Growth in Asia has helped commodity prices to stay high despite the worst global economic downturn since the Great Depression. Many commentators including myself thought that commodity prices would have collapsed further (and they still might) but the fact that they haven’t has been a bonus for Australia. Most commentators, including those in the mining sector itself, now believe that the boom will continue onwards and upwards, making a mockery of historical precedents for collapses in prices.

Lowe then turns to investment pointing out, as have Henry and Stevens in recent times, that Australia is a high investment country. In the past year, investment has reached 17 per cent of GDP – the highest on record. Almost a third of it has, not surprisingly, been in the resources sector. Australia’s growing capital stock during a global recession is a remarkable performance.

According to estimates based on ABS data, mining investment was the equivalent of almost 5 per cent of GDP over the past year, a record by a large margin. While we had booms in the mining sector in the late 1960s and the early 1980s, these look relatively small compared with the current one. Over the past couple of years, we have had particularly high rates of investment in both the iron ore and coal industries and this is now starting to show up in export volumes. For example, the volume of iron ore exports has risen by around a third over the past two years, as new mine and port capacity has come on stream, and further increases are likely.


Lowe argues that this high level of investment will continue, given the huge deals on LNG made recently for long-term supply contracts for China, Japan and India.
Such developments make the sort of shrill commentary from some business journalists that Australia needs to alter the discretionary elements of its foreign investment review process or suffer the consequences seem rather ridiculous. Australia should continue to review large-scale investments in its resource assets to make sure that they produce the greatest gain for the Australian people.

Australia’s prospects are undoubtedly better than virtually all other developed countries at the moment. But we still need to think about how to reduce our vulnerability to a downturn in commodities.

Tuesday, November 10, 2009

The Carry Trade Explained

Want to know one of the reasons why the movements of exchange rates can be so pronounced at times?

There are many reasons why exchange rates move.

The first thing to remember is that there are two sides to any currency story.

For example the current strength of the Australian dollar (the Aussie) is a product of Aussie strength and greenback weakness.

Now Aussie strength has a lot to do with the price of commodities, with the Aussie traditionally seen as a commodity currency.

The Aussie is also important as a trading currency because of its position in Asia, that is between the North American close and European opening. It's also important as an 'Asian' currency.

But another vital factor is the carry trade.

Despite being at so-called 'emergency' levels, Australian interest rates are actually high by international standards.
Japan 0.10%
Canada 0.25%

United States 0.25%
Switzerland 0.25%
Sweden 0.25%
UK 0.50%
Europe 1.00%
Taiwan 1.25%
Norway 1.50%
Korea 2.00%
New Zealand 2.50%
Australia 3.50%
Poland 3.50%

So if you borrow money in Japan at low rates of interest and then invest it in Australia at high rates of interest and the Yen-Aussie exchange rate either stays constant or the Aussie appreciates against the Yen, you end up making a truck load of cash.

But ...

If the Aussie falls against the yen as it did from late last year then you're stuffed and everyone runs for the door at the same time. This adds to what is often called 'momentum' in currency trades. Right now the 'momentum' is for a higher Aussie.

Anyway the following graphic from the Financial Times explains it much more neatly than I can do.
http://www.ft.com/cms/s/0/f3aec6c2-b99e-11de-a747-00144feab49a.html

See also Nouriel Roubini (2009) "Mother of all carry trades faces an inevitable bust", Financial Times, 1 November <http://www.ft.com/cms/s/0/9a5b3216-c70b-11de-bb6f-00144feab49a.html?nclick_check=1>

Roubini outlines what he calls 'the mother of all carry trades' involving US interest and exchange rates. The major financial issue at the moment is the growing financial bubble that has been reignited by low interest rates.

So what is behind this massive rally? Certainly it has been helped by a wave of liquidity from near-zero interest rates and quantitative easing. But a more important factor fuelling this asset bubble is the weakness of the US dollar, driven by the mother of all carry trades. The US dollar has become the major funding currency of carry trades as the Fed has kept interest rates on hold and is expected to do so for a long time. Investors who are shorting the US dollar to buy on a highly leveraged basis higher-yielding assets and other global assets are not just borrowing at zero interest rates in dollar terms; they are borrowing at very negative interest rates – as low as negative 10 or 20 per cent annualised – as the fall in the US dollar leads to massive capital gains on short dollar positions.
Now short dollar positions mean that investors are borrowing greenbacks to sell now ('going short') and pay back later when the greenback is (hopefully) lower. Of course the more that investors short the greenback the more likely it is to be lower. So what is the effect of low interest rates, quantitative easing and massive purchases of long-term debt instruments (the metaphorical printing of money)? According to Roubini it is
seemingly making the world safe – for now – for the mother of all carry trades and mother of all highly leveraged global asset bubbles.
But like all bubbles eventually they get pricked.
But one day this bubble will burst, leading to the biggest co-ordinated asset bust ever: if factors lead the dollar to reverse and suddenly appreciate – as was seen in previous reversals, such as the yen-funded carry trade – the leveraged carry trade will have to be suddenly closed as investors cover their dollar shorts. A stampede will occur as closing long leveraged risky asset positions across all asset classes funded by dollar shorts triggers a co-ordinated collapse of all those risky assets – equities, commodities, emerging market asset classes and credit instruments.
The question for risk-takers is how long should you stay in the market and what will cause the reversal.
Why will these carry trades unravel? First, the dollar cannot fall to zero and at some point it will stabilise; when that happens the cost of borrowing in dollars will suddenly become zero, rather than highly negative, and the riskiness of a reversal of dollar movements would induce many to cover their shorts. Second, the Fed cannot suppress volatility forever – its $1,800bn purchase plan will be over by next spring. Third, if US growth surprises on the upside in the third and fourth quarters, markets may start to expect a Fed tightening to come sooner, not later. Fourth, there could be a flight from risk prompted by fear of a double dip recession or geopolitical risks, such as a military confrontation between the US/Israel and Iran. As in 2008, when such a rise in risk aversion was associated with a sharp appreciation of the dollar, as investors sought the safety of US Treasuries, this renewed risk aversion would trigger a dollar rally at a time when huge short dollar positions will have to be closed.
The thing for investors to weigh up is timing.
This unraveling may not occur for a while, as easy money and excessive global liquidity can push asset prices higher for a while. But the longer and bigger the carry trades and the larger the asset bubble, the bigger will be the ensuing asset bubble crash. The Fed and other policymakers seem unaware of the monster bubble they are creating. The longer they remain blind, the harder the markets will fall.

Monday, November 9, 2009

Bubble Trouble

As I've long said I may just be a negative vibe merchant but everywhere I look I see bubbles - in China and in Australia, and the US stock market. While a few months ago it appeared that many had learned the lessons of boom times - that they don't last forever and that they nearly always end badly - we are back in boom time territory and the phrase 'this time it's different' (TTID) has truly made a comeback. The TTID mentality extends right across the spectrum from the property spruikers to the governor of the Reserve Bank and the Head of Treasury.

Latest figures from the ABS on Housing Finance show a seasonally adjusted rise of 4.8% for the month (that's an annualised rate 57.6%). Now it's obvious that govt grants to house buyers (really a grant to venders) have bolstered these figures and many people who believed (like me) that house prices would have fallen by now are thinking "I better get in the market now" or "I'll be paying even more soon". One truly wonders how high house prices can go.

Now there is one intervention that govts could do to restrict house price growth and that's increase supply. One of the original aims of public housing was to keep a lid on the private market, particularly for rentals.
But govts and much of the population associate rapidly rising house prices with prosperity when really they are drag on prosperity both present and future. Firstly they make one of the most significant costs in our lives more expensive and they divert investment away from potentially productive endeavours.

The next bubble or set of bubbles that indirectly could concern Australia are in China. As Rowan Callick (one of the best writers from The Australian) observes today there are worrying signs in Hong Kong and the rest of China:
Last week a flat on Conduit Road in Hong Kong's mid-levels was bought for a world record of $51m - $135,626 per square metre.
The dominant element of Beijing's anti-GFC stimulus package has comprised the rampant return of the "policy loans" to state-owned enterprises, plus the opening of credit to individuals with privileged access, thanks to party or other connections, to the state banks.
Interest rates are not only paltry but notional. This is more than low-cost capital, or even no-cost capital. Hardly anyone's thinking about repaying the billions of bucks involved. Most of it has swiftly found its way into property and shares. Within China, house sales have surged 70 per cent this year.
This raises interesting questions about the fulsome praise that has been lavished on the Chinese stimulus package, in Australia as elsewhere. Some of the spending has doubtless found its way to useful projects where investment will be returned, in a socially and economically beneficial way, for some time to come.
But it's more difficult to see what's gained from printing heaps more money and telling the government's banks to shovel it out to mates.
I highlighted the worry that no thought is being given to repayment. Debt is serious and right now we've forgotten that much of the GFC was built on a cavalier attitude to debt.

Property and share markets can easily develop bubbles - as prices go up, investors pour more money in and prices go up further, attracting more investment and so on. But eventually everyone realises that the bubble is really just air and sentiment changes.

Just remember one phrase:
The unsustainable cannot be sustained ...
Actually another one is worthwhile as well:
This time it's not different ...

Saturday, November 7, 2009

Debate on the Current Account Deficit

The following article might be quite helpful for those wanting to understand the debate about the current account deficit in Australia.

Balance of power
TIM COLEBATCH
THE AGE


October 24, 2009
http://www.theage.com.au/business/balance-of-power-20091023-hdgu.html

IN THE wake of the global financial crisis, a crucial question confronting policymakers is why Australia seems to have got away with so little damage?

Was it a lucky escape, which should be a wake-up call for us to tackle our persistent current account deficit before it brings us down? Or was it, rather, evidence that the quality of our economic policies has made us invulnerable to the shocks dealt out by global financial markets?

This week, two of the economists Kevin Rudd listens to most carefully delivered sharply different readings of what has been dubbed "Australian exceptionalism", and its implications for the current account balance.
In one corner is Ross Garnaut, one of Australia's most influential economists since the 1980s, as economic adviser to then prime minister Bob Hawke, author of the 1989 report that led to the virtual demolition of the tariff wall, and more recently, the man Rudd commissioned to draft his policy on climate change — albeit, a draft he then rejected as too rigorous.

Garnaut, of course, also has a considerable sideline in corporate Australia, as long-time chairman of Lihir Gold and former chairman of what we now call Bankwest. Add in his time as ambassador to Beijing, where his staff included a young Mandarin-speaking workaholic who went on to achieve great things, and he brings an unusual range of experience to bear.

In the other corner is Ken Henry, secretary of Treasury since 2001, Rudd's main adviser on the Government's fiscal stimulus package, and a man now bearing a very heavy workload as chairman of its tax policy review at the same time as running a Treasury that now finds its work constantly in the spotlights of a bitter political debate.

On most issues, Garnaut and Henry see eye to eye. Both are mainstream economic liberals who believe that free markets are a powerful force for good. But both temper their faith in markets with a strong social and environmental conscience. They look to the long term, share a global perspective — and are men of subtle minds.

Yet now they are in sharp conflict over the question of whether Australia can afford to go on running the most persistently large current account deficit in the Western world: a deficit that has now averaged 4 to 4.5 per cent of our gross domestic product for the past 30 years, and driven our net foreign debt from $8 billion to $633 billion, or 53 per cent of our GDP.

It is a concern to Garnaut. With co-author David Llewellyn-Smith, he has just published an absorbing account of the crisis, The Great Crash of 2008 (MUP, $24.99), which is rich in reflections on its implications for global power relationships, for the future development of the financial system, and for key countries, not least Australia.

Garnaut sees the crisis as vindicating his warnings during recent years about "the great complacency" in Australian policymaking: the belief that the current account deficit and the associated build-up of foreign debt don't matter, but simply reflect the confidence with which foreign investors see us.
Australia's growth in recent years, he argues, has been unsustainable, because so much has been funded by increasing foreign debt — and you can't increase foreign debt forever. "Australians," he says, "were the spendthrifts of the commodities boom".

"If expenditure, both government and private, is allowed to expand too much when commodity prices are exceptionally high, there will be dreadful problems when it becomes necessary to adjust to lower living standards as prices fall to more normal levels.

"Australia has two strikes against it: its huge current account deficits before the crisis, and the deterioration in its terms of trade. They mean that Australia will have to reduce average consumption levels more than most countries if it is to restore full employment on a sustainable basis."

Henry strongly disagrees. In an unusually passionate speech in Brisbane on Thursday, the Treasury chief voiced strong confidence in Australia's economic future, along with equally strong fears about what it might mean for our environmental future, and for our wildlife, if Australia adds another 13 million people by 2049, as Treasury now projects.

Without naming Garnaut but clearly targeting his critique, Henry argued that Australia faced "a set of structural changes more profound than anything in its history": the ageing of its population, tackling global warming and adapting to it, the spread of the IT and communications revolution to the delivery of services — and the rapid growth of China and India, and their demand for Australian minerals.

"China and India are only in the early stages of catching up with the living standards of the developed world, and this process could have a very long way to run," Henry declared. "We should get used to the idea that we could have structurally higher terms of trade for quite some time — possibly for several decades."
We should also get used to the fact that Australia will keep borrowing and running current account deficits far into the future, Henry said. All the big changes we face will require higher investment. And our population is too small to be able to adequately fund "an abundance of investment opportunities".

"Australia's sustained high current account deficits reflect high national investment rather than low national saving," Henry declared, flashing a graph showing the national savings rate soaring between 1990 and 2008. "And national investment levels could remain elevated for several decades."

Let's pause for a word of explanation. Current account deficits can be viewed on two planes. The deficit measures the gap between what you sell the world and what you buy from it (the trade deficit), plus the gap between what you pay to foreign investors here and what you earn from your own foreign investments overseas.

For Australia, both gaps are substantial. Over the past decade, our trade deficit has averaged 1.3 per cent of GDP, or $16 billion a year in today's money. Since 1980, Australia has run 25 annual trade deficits and only four surpluses — in the slumps of 1991-92, 2000-02, and 2008-09. Our income deficit has averaged 3.4 per cent rising, as mining profits and interest bills on the foreign debt have swollen.
But in analytical terms, the deficit can also be seen as the gap between Australia's savings and investment — which is the way Treasury prefers to view it. Since mining is capital-intensive, and our population is growing rapidly, Australia invests more than other Western countries. But despite the spin in Henry's speech, we are mediocre savers, consistently in the bottom half of the OECD in national savings to GDP, and in the bottom third for household savings.

(His graph used one of the oldest tricks of speakers flashing graphs: start your graph in the bust, and end it in the boom. Had his graph begun in 1987 instead of 1990, and ended in 2009 rather than 2008, it would have looked very different. Even at its peak in 2008, Australia's national savings rate was less than 20 years earlier, and it has plunged in 2009.)

Whichever way you prefer to view it, the solutions are the same. There are four ways to reduce the current account deficit. Export more. Import less. Save more. Or invest less.

Garnaut, a mining industry veteran, sees the high prices of recent years more as a transient phase, in which miners worldwide were caught unawares by China's rapid growth in demand. He also argues that China and India are going through a growth phase that is particularly resource-intensive.

Back in 2005-06, he argued in vain for the Howard government to save the windfall revenues from higher commodity prices, rather than handing them back in tax cuts and new spending. His book does not expand on this, but one option, advocated recently by Saul Eslake of the Grattan Institute, is to establish a sovereign wealth fund where temporary surges in company tax revenue could be stored for use in harder times.
Henry denies that policymakers have been complacent about the deficit. He argues that compulsory superannuation and a tradition of budget surpluses were established to lift saving rates and make Australia "able to sustain a sizeable current account deficit". His tax review is also expected to propose new tax breaks for savings, especially in the banks.

But can we sustain deficits of this size? No one can live indefinitely by borrowing. As your debts rise, so does the cost of servicing them. Henry's deputy, David Gruen, has estimated that Australia's debt-GDP ratio could be stabilised if the trade balance shifts by about 2 percentage points of GDP, from consistent deficit to consistent surplus. But there is no sign of that.

Henry's speech dismisses fears that one day financial markets might decline to roll over Australian debt, leaving borrowers stranded. "It would be difficult, I suggest, to construct a more demanding stress test of this vulnerability than that posed by the global financial crisis," he said. "The fact of our having passed that test provides grounds for some confidence, though certainly not complacency, in the strength of our policy frameworks and decision-making."

Yet as Garnaut points out in the book, it was precisely the refusal of foreign market to roll over bank debt in the panic of last October that led the Australian Government to guarantee the banks' wholesale borrowings. "Banks had become heavily reliant on foreign borrowing and suddenly they were unable to borrow abroad," he says. Had the Government not given the guarantee they sought, Australia would have faced an "enormously disruptive and costly" recession.

Was Henry's comment just a slip by an overworked public servant? Or did it imply that from now on, Australian banks' borrowings will carry an implied government guarantee, to be called on whenever needed?
As shadow trade minister in 2005-06, Rudd took up Garnaut's critique, advocating a higher priority for exports. Then as mineral prices surged and a trade surplus emerged, the issue faded from his priorities. But with export prices down 32 per cent this year, and trade now back in deficit by more than $1.5 billion a month, the current account deficit is back to haunt us.

Thursday, November 5, 2009

Public Debt (for Nerds)

Public debt is going to be a big issue in the coming years and the following is a summary of an excellent article from 3 economists at the Treasury, with some additions and updating with some recent statistics from the 2009-10 Budget and 2009-10 MYEFO.

From Treasury A History of Public Debt in Australia by Katrina Di Marco, Mitchell Pirie and Wilson Au-Yeung


The International Monetary Fund (IMF) Government Finance Statistics (GFS) manual defines gross debt as:

All liabilities that require payment or payments of interest and/or principal by the debtor to the creditor at a date or dates in the future. Thus, all liabilities in the GFS system are debt except for shares and other equity and financial derivatives [paragraph 7.142].

The main component of gross debt on the Australian Government’s balance sheet is Commonwealth Government Securities (Treasury Bonds) outstanding.

Gross debt does not incorporate amounts that are owed to government by other parties. Also governments, like an individuals or businesses, hold assets which can be sold to meet their financial obligations. To capture the asset side of equation, net debt needs to be considered.

Broadly speaking, net debt is equal to gross debt less a related pool of financial assets.2 Table 1 gives a simple representation of the main components that are included and excluded from the Australian Government’s net debt calculation.

Table 1: Components of net debt


Source: The Australian Treasury


Compared with gross debt, net debt is a better measure of a government’s overall indebtedness as it also captures the amount of debt owed to the government. Still, like gross debt, net debt is only a partial indicator of the government’s financial strength, as not all government assets or liabilities are included. As an example, unfunded superannuation is not included in the calculation of net debt. On the other side of the ledger, the equity holdings of the Future Fund are also not included as an asset in the calculation of net debt.

Australia has had historically low levels of net debt over the past two decades compared with the G-7 economies (Chart 2). In the early 1990s, Australia, along with the major economies, experienced an increase in net debt largely because of the global downturn. But in contrast to other economies, after 1995, Australia experienced a significant fall in its net debt.

Other measures of financial position

Over time, the demand for greater public accountability has led governments to publish more comprehensive sets of fiscal data. This has resulted in a trend towards using accrual accounting measures. By introducing a balance sheet into the primary Budget documents from 1999-2000, the Australian Government has been able to measure net financial worth and net worth.

• Net financial worth is defined as total financial assets less total liabilities.

• Net worth is defined as total assets less total liabilities.

Both measures are conceptually better than gross debt and net debt at capturing the Australian Government’s financial strength, as they are more comprehensive.

From MYEFO 2009


Definitions from the 2009-10 Budget

Measurement of the Government's financial position

Net debt is the most commonly quoted and well known measure of a government's financial strength. One of the reasons is that it is part of everyday life for business and households. Another reason is that, historically, it was the only available stock measure for governments that were recording financial information in a cash based accounting system. Net debt provides a useful measure for international comparisons, given most OECD countries report on it.

Net worth provides a more comprehensive picture of the Government's overall financial position than net debt. However, the valuation of physical assets can be problematic as they are typically valued without consideration of their potential use. Also, the Government may not be in a position to sell certain non financial assets, and therefore these assets would not be available to meet the Government's financing requirements.

Net financial worth is used by the Government as the primary indicator of balance sheet sustainability, because it provides a more effective and intuitive indicator of the sustainability of the Government's finances. It is a broader measure than net debt as it includes government borrowing, superannuation and all financial assets, but is narrower than net worth since it excludes non financial assets. There are advantages to excluding non financial assets since they are often illiquid and cannot easily be drawn upon to meet the Government's financing needs.

The projected deterioration in net financial worth is largely driven by the sharp downward revisions to tax receipts over the forward estimates resulting from the deterioration in the global economic outlook.

From Treasury A History of Public Debt in Australia by Katrina Di Marco, Mitchell Pirie and Wilson Au-Yeung

The difference between the two measures is the inclusion of non-financial assets in net worth. Given concerns surrounding the valuation of non-financial assets and their liquidity in the face of adverse shocks, the Australian Government has decided to use net financial worth as its primary indicator of balance sheet sustainability.

During the First World War, gross Australian Government debt increased from around 2.2 per cent of GDP to around 50 per cent of GDP (Chart 5), with around one-third of this increase met through loans issued in London (AOFM 2003-04). By comparison with the First World War, the financing requirements of the Second World War were met largely through domestic borrowing. Gross Australian Government debt increased from around 40 per cent of GDP in 1939 to around 120 per cent of GDP in 1945. During both wars, War Savings Certificates, targeted at retail investors, were the primary instruments used to raise funds.


Australian Government debt was progressively reduced after the Second World War and largely eliminated by the beginning of the 1970s. In the decade following the Second World War, relatively tight fiscal policy halted the growth in gross debt, while high inflation underpinned the sharp reduction in gross debt as a share of GDP. By 1974, gross debt had declined to around 8 per cent of GDP from a peak of around 120 per cent of GDP in 1946.


There were two further episodes of debt accumulation, and subsequent reduction, during the 1980s and early 1990s driven by periods of weak economic growth and associated budget deficits. From the mid-1990s, as the Australian Government’s fiscal position improved, gross debt declined steadily as a share of GDP.

The Australian Government historically had a significant proportion of its debt denominated in foreign currencies, but foreign-denominated debt is now negligible (Chart A).

For the first 30 years after Federation, foreign currency debt made up around 35 per cent of total debt on issue. A large portion of this debt was financed from London. Between 1940 and 1950 the amount of foreign currency debt fell as domestic markets grew in size. After the Second World War, the value of foreign currency loans began to rise to finance balance of payment deficits (AOFM 2002-03).

The share of foreign currency borrowings of the Commonwealth Government Securities (CGS) portfolio remained around 30 per cent from 1970 until 1988. In 1988, the Government decided to concentrate debt issuance in domestic markets to maintain liquidity and efficiency.

Capital account liberalisation has underpinned an increase in foreign holdings of Australian dollar-denominated CGS since the early 1980s (Chart B).


Chart 6 shows that the Australian Government has historically had a positive net debt position — that is, the value of debt liabilities has exceeded the value of debt assets. Since 1970-71, net debt has averaged 5.7 per cent of GDP, reaching a peak of 18.5 per cent in 1995-96, and a low of -3.8 per cent of GDP in 2007-08. Changes in net debt have largely been driven by changes in the government’s budget position.7 Especially in the 1990s, asset sales have also been a significant contributing factor (Box 2).
 
 
During the early 1970s net debt was mainly negative and reached lows of -3.1 per cent of GDP. During the first half of the 1970s budget surpluses averaged 1.7 per cent of GDP, while in the second half, there were budget deficits averaging around — 1.6 per cent of GDP. By 1979-80, net debt was around 4.7 per cent of GDP.


During this same period, the current account deficit was on the rise and reducing the Government’s call on foreign capital was an important driver of fiscal policy (Kennedy, Luu, Morling and Yeaman 2004). As a result, in 1988, the government decided to concentrate its debt issuance in Australian dollars (Box 1). In 1987, 30 per cent of total borrowings were in foreign currencies. By 1990-91 it was around 21 per cent.

In the early 1990s recessions in many advanced economies caused a marked slowing in the world economy. The government implemented a more expansionary fiscal policy that was funded by borrowing. Net debt reached a peak of 18.5 per cent of GDP in 1995-96.

From 1995-96 onwards, the government undertook a program of fiscal consolidation (Kennedy, Luu, Morling and Yeaman 2004). The government also undertook significant sales of Public Trading Enterprises around this period (Box 2).

The combination of successive budget surpluses and asset sales led to the elimination of net debt. Net debt as a proportion of GDP gradually declined to its historical low of -3.8 per cent of GDP in 2007-08.

Conclusion

A government’s balance sheet comprises both assets and liabilities. This article has demonstrated that only considering gross debt can result in an incomplete picture of public finances. By taking into account assets the public sector owns, a more accurate view of a government’s ability to respond to economic conditions can be determined.

This article has shown that Australia has undergone several periods of debt accumulation, followed by periods of fiscal consolidation. Periods of strong economic growth following episodes of debt accumulation have helped support relatively quick improvements in the public sector’s net debt position. Australia has a low level of net debt both historically and when compared with G-7 economies.

Wednesday, November 4, 2009

Debt

Steve Keen has long been the dangerman of Australian economic debate. I think Keen may have got a bit carried away with the time frames of his concerns about debt and about the immediate severity of any debt damage. Despite some arguments that Keen has been ignored in Australia in my estimation he's been given a fairly wide scope and got carried away with an 'end is nigh' message. It's more likely that debt damage in Australia will be slow moving rather than a rapid rupture. Australia may be vulnerable but it is not facing catastrophe.

Anyway, the following is a fairly humorous episode in Australian economic debate.

http://www.abc.net.au/pm/content/2009/s2688011.htm

MARK COLVIN: Dr Steve Keen of the University of Western Sydney was one of the doomsayers of the global credit crisis. He argued for years that the Western world was running up an unsustainable bubble of debt and asset-price inflation which was bound eventually to cause a crash.
He might have got that right, but he's lost another bet. He made the wager about house prices with another economist, Macquarie Bank's Rory Robertson. The loser has to walk 220 kilometres - from Parliament House in Canberra to the peak of Mt Kosciuszko.
And he has to do it in a shirt with the words: "I was hopelessly wrong on house prices, ask me how."
Steve Keen spoke to economics correspondent Stephen Long.
STEVE KEEN: Well it's intriguing how governments around the world really realise we're in an incredibly serious crisis and the scale of expenditure governments have gone into has been simply unprecedented.
There's reasonable estimates to say that the level of spending that's been put in the last year and a half to fight this crisis is equivalent to the inflation-adjusted cost of the entire World War II campaign and as a result what would have been a 5 or six 6 cent fall in our output for a lot of countries, has ended up being between a 0 per cent and a 2 per cent rise.
But we can't keep on spending at the rate of World War II every year for the rest of the century.
STEPHEN LONG: Do you concede though that policy made a difference and perhaps you under estimated that the impact that policy could make in combating the situation?
STEVE KEEN: Yeah I did. I think the scale of reaction was greater than I expected. The stimulus is certainly papered over the beginning of the downturn but it's not a long-term solution.
STEPHEN LONG: Well can you tease that out for me. Why don't you see it as a long-term solution?
STEVE KEEN: Because we have a Government which has given an enormous stimulus to the economy and yet at the same time, you have a credit system which has been stimulating the economy for the previous 40 years by increasing debt levels.
And we are suddenly going to have an economy where rather than increasing debt, adding to demand, we're going to have an economy where people's attempt to reduce it is going to subtract from demand so the Government's going to be pushing against a headwind of private sector deleveraging from now on.
STEPHEN LONG: So your argument is that if America and Europe can't continue with debt-fuelled consumption and they don't have export markets that can make up the difference, there's really no way for their economies to spark a genuine recovery?
STEVE KEEN: If you look in America, you've got a business sector with the biggest level of debt its ever had in its history, a household sector with three times as much that it had back in the 1990s crisis, the biggest in its history as well, and a financial system again with the biggest level of debt its ever had. Who can there be left lend to? The only people, group they haven't lent to in America so far are already behind bars.
Now in Australia, there's a couple of differences and that scares me because I can now see a lot of property spruikers pushing for access to superannuation funds so they can lend to the superannuation funds. If that happened, we'd restore lending here but it would be a recipe for the biggest Ponzi crash in the future after a short period of apparent prosperity.
STEPHEN LONG: OK, well speaking of Australia and property, one of your predictions was that we would see a 40 per cent fall in house prices, it hasn't happened. Why not?
STEVE KEEN: Because I said over 10 to 15 years. This is one of those things where sometimes you'd like to bite your tongue afterwards for saying things like this because it's always taken out of context.
I was asked what would happen to Australian property prices in a crash and I said, I see no reason why we won't go through the same fate Japan has gone through where prices have fallen 40 per cent over a 10 to 15 year period. The statute of limitations of that prediction is 2025. We're still a few years away from then.
STEPHEN LONG: Now Steve Keen, you've got a bet with a market economist, Rory Robertson of Macquarie, involving house prices, men and mountains. Do you want to explain that bet and how it works?
STEVE KEEN: OK. Now this was sprung on me by Rory to talk at parliament house. The basic details are that if I'm wrong, I have to walk from parliament house to Mt Kosciuszko, if Rory's wrong he's got to do the walk. The conditions that Rory put forward were that if prices fall by less than 20 per cent, I have to walk. If they fall by more than 40 per cent, he has to walk, and there's a dead band in the middle.
The bet from my point of view was always peak to trough. Whatever the peak ends up being, to whatever the trough is over a 10 to 15 year period I expect it to be at a 40 per cent fall. For the sake of closure, we also agreed that the house price index was 131 on the ABS since September 2008. If it breaks that level before 2010, then I will take that as me having lost the second stage of the bet.
STEPHEN LONG: In plain and simple terms then, if house prices have gone up by the end of this year, then you have to walk from Canberra to Mt Kosciusko?
STEVE KEEN: That's right and if they then end up falling later than that stage by 40 per cent from whatever their peak is to whatever the trough ends up being, then Rory has to do a walk and he's a slightly older man than he is now.
STEPHEN LONG: And what do you reckon your prospects are at the moment?
STEVE KEEN: Virtually 100 per cent certain I'll be walking and I'd say exactly the same for him in about 10 years time. The boost to house prices courtesy of what I call the First Home Vendors Grant has been substantial.

It hasn't only pushed up lower level prices below the $500,000 mark, it's also boosted prices up to $1 million or more because when those vendors sold the houses to the first home buyers, they got an extra $30,000 or $40,000 in cash which they leveraged up to an extra $200,000 to go and buy houses in the medium to high price range.

So it's boosted prices right up and that's why I'm going to be wearing a walk to Kosciusko next year. But as the old joke line says "the harder they come, the harder they fall". We'll hit a higher peak and I think we're going to have a larger fall courtesy of that.

MARK COLVIN: The debt doomsayer Steve Keen, with Stephen Long.

Sunday, November 1, 2009

Global Imbalances

The NY Times recently had an op-ed piece by Nouriel Roubini on the global imbalances (GIs) - an issue I've been following for years due to my interest in current account deficits (yes dull I know).

Nouriel Roubini achieved fame as the man who predicted the global financial crisis and there is no doubt that his speech in 2006 to the IMF was generally dismissed because Roubini was like a few others a permanent negative vibe merchant or prophet of doom. The financial markets call such commentators permabears. The NY Times' Stephen Mihm ran a profile in August 2008 titled Dr Doom:
On Sept. 7, 2006, Nouriel Roubini, an economics professor at New York University, stood before an audience of economists at the International Monetary Fund and announced that a crisis was brewing. In the coming months and years, he warned, the United States was likely to face a once-in-a-lifetime housing bust, an oil shock, sharply declining consumer confidence and, ultimately, a deep recession. He laid out a bleak sequence of events: homeowners defaulting on mortgages, trillions of dollars of mortgage-backed securities unraveling worldwide and the global financial system shuddering to a halt. These developments, he went on, could cripple or destroy hedge funds, investment banks and other major financial institutions like Fannie Mae and Freddie Mac.
The audience seemed skeptical, even dismissive. As Roubini stepped down from the lectern after his talk, the moderator of the event quipped, “I think perhaps we will need a stiff drink after that.” People laughed — and not without reason. At the time, unemployment and inflation remained low, and the economy, while weak, was still growing, despite rising oil prices and a softening housing market. And then there was the espouser of doom himself: Roubini was known to be a perpetual pessimist, what economists call a “permabear.” When the economist Anirvan Banerji delivered his response to Roubini’s talk, he noted that Roubini’s predictions did not make use of mathematical models and dismissed his hunches as those of a career naysayer.


(See also David Hirst's piece in The Age in August 2009)

Since then, however, Roubini's predictions have been seemingly less accurate, especially on the US economy and stock market in 2009. And he continues to attract criticism. The US stock market has done better than most imagined and the US economy just recorded annualised growth of 3.5 % (In Australia we record growth for the quarter ... so US growth was roughly 0.9 % in Australian terms). [While writing this I'm fittingly listening to Albinoni's adagio in G Minor]. There is still a chance that the end result of 2009 will be worse than is now being predicted. I, for example, remain a negative vibe merchant about the prospects for sustained growth in the short-to-medium-term (1-2 years).

In his op-ed piece Roubini defines the GIs as:
Global imbalances — roughly defined, the different emphasis the world’s leading economies place on savings, spending and debt — is a phrase much used and little acted upon.
He then notes that they have been on the international policy agenda for quite some time. This is true, while writing my book I was intrigued by the literature that increasingly argued that there was no real problem with the huge imbalances. (see Chapter 3)

While there has been some narrowing of the GIs over 2009 partly due to the recession in the US and the huge stimulus in China and the collapse of Chinese exports, the GIs remain a problem.
the financial crisis has contributed to a significant narrowing of global economic imbalances. Consumers in so-called “deficit countries” — states like the U.S., Britain, Spain and the countries of Eastern Europe that have huge trade deficits — are saving more as the crisis has exposed the dangerous extent of their indebtedness. Meanwhile, in China and other large export-driven economies, fiscal stimulus spending and some other policy moves have encouraged more domestic consumption.
As Roubini points out changing ingrained habits - too much saving in Asia (particularly China) and too much debt-fuelled spending in the US (and Australia) - is very difficult.  And so the idea that the GIS will naturally lessen as a result of market forces is a dangerous assumption. While US consumers have been forced to tighten their belts to an extent, it's difficult to make people in China save less and spend more. Even the stimulus has not been sufficiently aimed at consumption to change habits. Roubini argues that the rebalancing is temporary "the result of reactive policy measures among exporters and retrenchment among the profligate."
China, the world’s sovereign wealth machine over the past decade, is a case in point. My colleague, Rachel Ziemba, projects China’s current account surplus will likely narrow to $350-370 billion depending on the import trajectory, down from a record $420 billion in 2008. China’s trade surplus was just under $100 billion in the first half of 2009. A trade surplus of about $30 billion in the third quarter of this year is expected, which is well below 2008 levels. Increased spending at home rather than savings could further reduce the surplus. Yet with China reluctant to allow currency appreciation, reserve accumulation has resumed at a strong pace.
Although the export-oriented growth model has been shaken by the crisis, many countries seem reluctant to recalibrate. The beginning of inventory restocking has buoyed Asia significantly, as companies that cut back sharply have now increased output. Avoiding currency appreciation will exacerbate this trend, adding to reserve accumulation and distortions.
The question becomes who will take up the slack of Chinese surpluses in the absence of the US continuing its status as the 'buyer of last resort' par excellence. Roubini notes that the IMF suggests a diffusion of the GIs.
where surpluses of Germany and Japan will remain in shrinking mode even in 2010, while the deficits of Canada and Australia, as well as emerging economies like Brazil, will offset the growth of China’s surplus.
Roubini points out that the GIs are back on the policy agenda of the G20 but probably can't be solved by communiqué. What is required instead is a organisation with teeth to force adjustment. This is an idea of long standing going back to Keyes view in the Bretton Woods negotiations that both deficit and surplus countries should be made to adjust.
Global imbalances are back on the policy agenda with the G-20 agreeing to create a peer review of macroeconomic policies including imbalances to avoid another crisis. The details are limited so far, but focus once again on an agreement that the U.S. will consume less and save more; Japan, Germany and China will spend more and will reallocate investment away from the export sector.
These are the right goals, to be sure. But a joint communiqué from a nascent international organization isn’t much to hang the world’s hat upon. The I.M.F. needs teeth, perhaps along the lines of the W.T.O.’s authority to prod member states toward “out of court” settlements, in order to enforce these difficult political and economic goals.

Basically there is no chance of this happening unless there was another severe economic downturn and even then it is unlikely that countries would agree on the causes of the crisis, thus negating a sound solution (just think of the many and varied views on what caused the current crisis.

The problem is that the GIs provide an impetus for the creation of crisis and bubbles. While Roubini correctly points out that the GIs did not cause the crisis they did provide the liquidity backing for it and are part of the crisis equation.
While imbalances did not cause the current financial crisis — I believe lax regulation bears a far greater onus — these imbalances certainly helped create the conditions for this crisis. Easy money and low long-term interest rates created an incentive to invest in seemingly-safe high-yield assets. An orderly unwinding of imbalances might put a lid on global growth during the adjustment, but is fundamental to achieve sustainable global growth.