Showing posts with label Military spending. Show all posts

Friday, March 27, 2015

Charts of the Week

The purple areas are spreading the arms wealth+


Note Australia not in the big league


High levels of household debt will eventually have to be reversed. The argument of the Reserve Bank is that because most of the debt is owned by richer households it will not be a problem going forward. I'm not so sure.


Housing dominates household debt, funnily enough. 


Investor housing has shifted into the purchase of existing properties. One day soon Australians will realise that buying and selling houses to each other and digging things out of the ground is not a sustainable model for a rich country. 


The growth of apartment building.


Foreign ownership of farmland. Why this is a more important issue than our 80 per cent foreign owned mining sector is beyond my reasoning capabilities. Farmland can be neglected or overused but it can't be taken out of the country. Mining commodities are exported and gone.


We don't seem particularly concerned about the Canadians buying farms and agricultural producers.


Rapid Chinese growth from a low base.


The growing importance of services in consumption, with education more than doubling its share


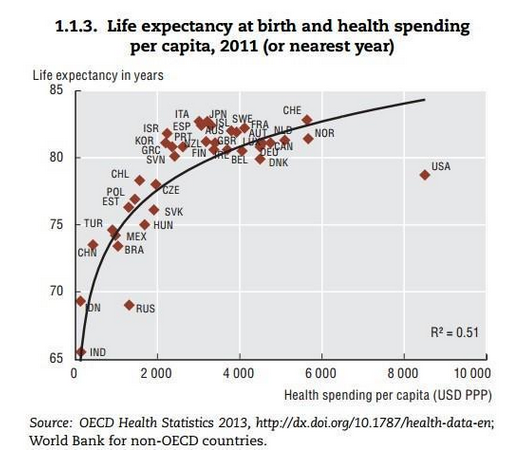
US as an outlier on health spending


 The breakdown of taxes levied by the Commonwealth in Australia.


Greeks work longest in Europe, apparently.


Coal use continues to expand in Asia, while oil continues its slide. Gas and renewables continue to gain ground.

Tuesday, August 26, 2014

Global Military Spending

There are several ways to consider and compare global military spending. The most obvious way is to calculate total military spending and convert to US Dollars. Another important measure is to consider the level of spending as a percentage of a country's GDP. We start with the second way first. (See the end of the post for a definition of military spending)

I constructed this from a World Bank database (based on SIPRI Stockholm International Peace Research Institute figures). Comparing military spending as a percentage of GDP allows us to consider how much of economic growth is taken up with military expenditures.

While the United States has the world's largest military by far it ranks only 13th on the level of spending as a percentage of GDP. Importantly SIPRI doesn't construct figures for North Korea. Estimates for North Korea range from 20-33 per cent of GDP.


Rank Country            2013
1 Oman 11.48
2 Saudi Arabia 8.99
3 Afghanistan 6.24
4 Israel 5.63
5 Angola 5.01
6 Algeria 4.95
7 Azerbaijan 4.68
8 Lebanon 4.36
9 Russian Federation 4.19
10 Armenia 4.10
11 Yemen, Rep. 3.93
12 Morocco 3.90
13 United States 3.81
14 Bahrain 3.77
15 Jordan 3.56
16 Mauritania 3.56
17 Iraq 3.54
18 Colombia 3.44
19 Pakistan 3.39
20 Singapore 3.27
21 Kyrgyz Republic 3.24
22 Namibia 3.15
23 Ecuador 3.11
24 Swaziland 2.96
25 Ukraine 2.93
26 Zimbabwe 2.78
27 Georgia 2.74
28 Sri Lanka 2.71
29 Korea, Rep. 2.60
30 Brunei Darussalam 2.56
31 Greece 2.46
32 India 2.45
33 Turkey 2.33
34 United Kingdom 2.30
35 France 2.24
36 Burundi 2.24
37 Vietnam 2.18
38 Portugal 2.17
39 Serbia 2.17
40 Uganda 2.16
41 Lesotho 2.15
42 China 2.05
43 Botswana 2.02
44 Tunisia 2.01
45 Chile 1.96
46 Estonia 1.96
47 Kenya 1.95
48 Uruguay 1.87
49 Timor-Leste 1.81
50 Poland 1.79
51 Zambia 1.69
52 Egypt, Arab Rep. 1.67
53 Croatia 1.66
54 Australia 1.63
55 Cambodia 1.60
56 Paraguay 1.60
57 Bulgaria 1.58
58 Italy 1.58
59 Montenegro 1.57
60 Malaysia 1.55
61 Thailand 1.52
62 Bolivia 1.45
63 Nepal 1.43
64 Peru 1.42
65 Norway 1.41
66 Burkina Faso 1.41
67 Mali 1.41
68 Brazil 1.40
69 Congo, Dem. Rep. 1.40
70 Denmark 1.38
71 Bangladesh 1.37
72 Malawi 1.36
73 Belarus 1.35
74 Fiji 1.34
75 Germany 1.34
76 Cameroon 1.34
77 Romania 1.33
78 Gabon 1.32
79 Albania 1.30
80 Netherlands 1.29
81 Philippines 1.28
82 Finland 1.27
83 Kazakhstan 1.25
84 Honduras 1.24
85 Macedonia, FYR 1.24
86 Venezuela, RB 1.21
87 South Africa 1.17
88 Sweden 1.17
89 Tanzania 1.15
90 Bosnia and Herzegovina 1.13
91 Rwanda 1.11
92 El Salvador 1.10
93 Czech Republic 1.08
94 Guyana 1.07
95 Belize 1.04
96 Belgium 1.04
97 Benin 1.04
98 Seychelles 1.03
99 Canada 1.01
100 New Zealand 1.00
101 Japan 0.99
102 Spain 0.94
103 Indonesia 0.90
104 Jamaica 0.85
105 Ethiopia 0.82
106 Switzerland 0.78
107 Austria 0.78
108 Nicaragua 0.76
109 Liberia 0.75
110 Argentina 0.74
111 Mexico 0.62
112 Dominican Republic 0.61
113 Papua New Guinea 0.57
114 Ireland 0.55
115 Ghana 0.53
116 Madagascar 0.51
117 Luxembourg 0.51
118 Cabo Verde 0.50
119 Guatemala 0.48
120 Nigeria 0.47

US military spending has declined over recent years, whilst China's has increased. Since 2004 Chinese military spending has increased by 170 per cent, whilst its GDP Has increased by 140 per cent. Still China only spends 2.05 per cent of its GDP while the US spends 3.81 per cent. Japan, due to its pacifist constitution still spends just under 1 per cent. 

The table below constructed from SIPRI databases shows basic measure alluded to above of total military spending converted to US Dollars. It shows the top 60 military spenders in the world (New Zealand comes in at 60). 

Figures are in US$m. at 2013 prices and exchange rates. 

RankCountry 2013 
1USA                           640221
2China, P. R.                  188460
3Russia87836
4Saudi Arabia                  66996
5France                        61228
6UK                            57891
7Germany                       48790
8Japan                         48604
9India                         47398
10Korea, South                  33937
11Italy                         32657
12Brazil                        31456
13Australia                     23963
14Turkey                        19085
15Canada                        18460
16Israel                        16032
17Colombia                      13003
18Spain                         12765
19Taiwan                        10530
20Algeria                       10402
21Netherlands                   10328
22Singapore                     9759
23Poland                        9257
24Oman                          9246
25Iraq                          7896
26Indonesia                     7840
27Mexico                        7838
28Pakistan                      7641
29Norway                        7235
30Sweden                        6519
31Angola                        6095
32Greece                        5939
33Thailand                      5891
34Kuwait                        5815
35Chile                         5435
36Ukraine                       5338
37Venezuela                     5313
38Belgium                       5264
39Switzerland                   5053
40Malaysia                      4842
41Portugal                      4784
42Denmark                       4553
43Argentina                     4511
44Egypt                         4255
45South Africa                  4108
46Morocco                       4064
47Philippines                   3472
48Azerbaijan                    3440
49Viet Nam                      3387
50Finland                       3262
51Austria                       3230
52Peru                          2865
53Ecuador                       2803
54Kazakhstan                    2799
55Romania                       2521
56Nigeria                       2411
57Myanmar                       2211
58Czech Rep.                    2149
59Lebanon                       1936
60New Zealand                   1833


In terms of total military spending the US still dominates with 37 per cent of the total compared to China's 11 per cent. This means that China's spending is about 30 per cent of the US figure. 


Note that these figures are measured in US dollars meaning they are subject to the same problems of measurement outlined in How Big, How Rich, How Developed. Constructed on a PPP basis, Chinese military expenditure would be more substantial as a percentage of the total.

The table from the PDA (Project on Defense Alternatives) below shows different measures for military spending from SIPRI and IISS (International Institute for Strategic Studies).


What this table makes clear is that how we measure military expenditure matters for our perceptions about China's rise and US relative decline. However, it also seems reasonably clear that the US retains an overwhelming military dominance regardless of the measure. 

Australia, despite significant declines in spending as a percentage of GDP ranks as the 13th largest military spender. 


Given the Abbott government's focus on the seriousness of the Islamic terrorist challenge and promises made, it seems clear that military spending will rise in coming years as will expenditure on domestic policing and surveillance. 


Military expenditures data from SIPRI are derived from the NATO definition, which includes all current and capital expenditures on the armed forces, including peacekeeping forces; defense ministries and other government agencies engaged in defense projects; paramilitary forces, if these are judged to be trained and equipped for military operations; and military space activities. Such expenditures include military and civil personnel, including retirement pensions of military personnel and social services for personnel; operation and maintenance; procurement; military research and development; and military aid (in the military expenditures of the donor country). Excluded are civil defense and current expenditures for previous military activities, such as for veterans' benefits, demobilization, conversion, and destruction of weapons. This definition cannot be applied for all countries, however, since that would require much more detailed information than is available about what is included in military budgets and off-budget military expenditure items. (For example, military budgets might or might not cover civil defense, reserves and auxiliary forces, police and paramilitary forces, dual-purpose forces such as military and civilian police, military grants in kind, pensions for military personnel, and social security contributions paid by one part of government to another.)
Stockholm International Peace Research Institute (SIPRI), Yearbook: Armaments, Disarmament and International Security.

Tuesday, September 4, 2012

Selling Weapons is Big Business

Selling weapons is big business. The Economist shows that the Cold War has had some lasting effects beyond Taiwan and North Korea, with the United States and Russia still the biggest arms dealers. According to The Economist:
Arms deals were buoyed last year by unusually high demand from Saudi Arabia. The Middle Eastern country is the developing world’s biggest arms buyer; deliveries were $2.8 billion in 2011. India, which is Russia’s biggest high-value arms client, was close behind, with $2.7 billion-worth of deliveries last year.

Those Cold War connections still count. According to another report declining military spending in the US is pushing US firms to look for new export markets.
... analysts cautioned that the sales are also indicative of economic realities in the US, where tighter budgets have shifted the defence industry's gaze toward exports. 
In the case of fighter jets, for example, the US has delayed production of its own next generation of aircraft. Had the deal with Riyadh not been signed, manufacturers might have had to shut down production altogether ...  
Although the Gulf arms market is expected to remain strong in coming years, this year will probably prove to be an anomaly for US sales because of the large Saudi deal. The $66.3bn figure represents the value of all arms deals signed but the weapons and aircraft will be delivered as far as several decades out.

The place to go for detailed assessments of military spending and the like is SIPRI (Stockholm International Peace Research Institute).

SIPRI reports that world military spending was flat in 2011:
World military spending in 2011 is estimated to have been $1,738 billion. While the figure is higher in dollar terms than in 2010, this is largely the result of changes in prices and, more importantly, a falling dollar. When measured in real terms (constant 2010 prices), the total for 2011 is just 0.3 per cent higher than in 2010. Given the uncertainties in the data, this means that world military spending was essentially unchanged in 2011, breaking a 13-year run of continuous military spending increases.
But the disaggregated picture was more interesting:
The levelling-out of military spending results from a very mixed pattern of changes in different countries and regions. ... This included:
  • A decrease in the US of 1.2 per cent in real terms, the first fall in US military spending since 1998;
  • A moderate increase in Asia and Oceania (2.3 per cent)
  • Falls in Western and Central Europe (1.9 per cent) due to austerity measures, matched by a large increase (10.2 per cent) in Eastern Europe
  • A substantial increase (4.6 per cent) in the Middle East
  • A moderate (3.3 per cent) decrease in Latin America large increase (8.6 per cent) in Africa.

US spending fell last year for the first time since 1998. Two factors are driving the fall.
The withdrawal of US forces from Iraq and the gradual drawdown in Afghanistan, which means reduced spending on the additional war budget, otherwise known as Overseas Contingency Operations. This can be expected to continue if plans to end combat operations in Afghanistan in 2014 are fulfilled, and if the US does not become involved in any major new war.
The Budget Control Act, passed by Congress in 2012 as an attempt to reduce US national debt, will also affect military spending. The immediate effect of the Act was to require cuts of $487 billion from the Department of Defense budget from 2012–21, compared with previous plans. However, as those plans involved an increasing ‘base’ DoD budget (excluding Overseas Contingency Operations), the effect of the Act will mean relatively flat budgets in real terms up to 2021. ...
These falls may be much higher if further cuts mandated by the ‘automatic sequestration’ clause of the Budget Control Act take place.4 This provides for automatic across-the-board cuts theoretically commencing in January 2013 and totalling $1.2 trillion by 2021, including $500 billion from National Defense.

However, several members of Congress have initiated moves to prevent or delay the military spending portion of the cuts from taking effect, arguing that such cuts would jeopardize US national security.5 These additional cuts have not been accounted for in current budget projections, or in the Administration’s FY2013 budget request.The decline in US spending is likely to have an effect on total military spending because the US accounts for 41 per cent of the global total.


Military spending in Asia and Oceania is up, so we're pulling our weight in covering for those US declines. But Eastern Europe, Africa and the Middle East are clearly leading the way to account for American declines (both South and North)

But as a recent cartoon from xkcd made clear, growth (flow) figures need to cited in relation to overall (stock) figures. (incidentally probably the best cartoon since Calvin and Hobbes in my humble opinion)


Although the diagram doesn't say it, I'm assuming the red bit is Asia and Oceania with 20.9 per cent (the amount remaining).

Unsurprisingly China's growth has been the most significant development in the region. According to SIPRI the rate of growth has slowed slightly in recent years to about 2.3 per cent compared to a rate of 6.3 per cent (all figures are in real terms)between 2000 and 2009.

Most of the regional increase was due to Chinese growth of 6.7 per cent - around $8 billion in constant 2010 prices.  

Since 2002, China has increased its spending by 170 per cent. Since 1995, spending has increased by more than 500 per cent (that's in real terms).

Total Chinese spending in 2011 was 923 billion Yuan ($US143 billion), which makes it the global number two. Interestingly, it has managed to do this without increasing military spending as a percentage of GDP. It has remained at approximately 2 per cent since 2001.

A growing economy does allow for a growing military.
The increased military spending has allowed both increased salaries and better conditions for troops, as well as extensive modernization of military equipment and technology, as part of a drive to ‘informationatize’ the armed forces. Chinese military technology remains, however, one to two generations behind that of the US.
Obviously these increases cause worries in the region, not the least in Australia, where the subject of Chinese power often dominates my undergraduate and postgraduate seminars.

SIPRI, however cautions against the idea that there is an arms race going on in the region.
both data and analysis reveal a mixed pattern of trends in military expenditure and arms acquisition, with China far from the only driving factor.
The two countries that have responded most to China's spending are India and Vietnam. Australia talked about increased military expenditure, but the spending plans contained in the 2009 White Paper are dead and buried.

Since 2002 India has increased military spending by 66 per cent, while Viet Nam has increased military spending by 82 per cent since 2003. Both countries spending fell in 2011, perhaps reflecting growing economic woes. Taiwan's spending has grown by only 13 per cent since 2002, while Japanese spending has declined over recent years.

Other countries include

The Philippines - 7.4 per cent increase since 2002.

Indonesia - 82 per cent since 2002

Thailand - 66 per cent

Cambodia - 70 per cent

For the sake of comparison here's a graph of military spending as a percentage of GDP for a few select countries.

Friday, June 29, 2012

Global Military Spending Revisited

I've always been an advocate for looking at different sources and methodologies for measuring things.

This is especially the case for economic size as I argued here.

It also applies to military spending.

The table from the PDA (Project on Defense Alternatives) below shows different measures for military spending from SIPRI (Stockholm International Peace Research Institute) and IISS (International Institute for Strategic Studies). (H/T Lowy Interpreter)

It also considers PPP (purchasing power parity) measures, which account for discrepancies in the costs of production and consumption in different countries.

What all measures still clearly show is that the United States remains the key military spender by a long way.

Many Australians I think would be surprised about Australia's high position on the table.

Alongside measures of Australia's relatively excellent economic performance, it shows Australia's significance on the world stage, even if, for many, this is not a measure of significance they support.


 Notes:
* International Institute for Strategic Studies
** Stockholm International Peace Research Institute


*** PPP = Purchasing Power Parity, a measure that facilitates international budget comparisons by adjusting exchange rates to reflect the relative domestic buying power of national currencies.

Notes: The IISS column presents officially reported spending in USD at 2010 exchange rates, with two exceptions: China and Russia. For these, the number is an estimate of actual spending. The second column is SIPRI’s estimate of actual expenditures, also shown in USD at 2010 exchange rates. The PPP column converts estimates of actual expenditures into approximate purchasing power, mostly drawn from SIPRI data. For China and Russia, it also shows an IISS estimate of purchasing power, thus producing a range. Purchasing power calculations improve on estimates that use exchange rates alone. However, PPP ratios are based on comparisons between national economies as a whole, not the defense sectors specifically. This can overstate military purchasing power when a nation’s military sector is much more advanced than its economy overall or when a nation depends heavily on international arms purchases.

Sources: International Institute for Strategic Studies, The Military Balance 2012 (London, 2012); Stockholm International Peace Research Institute, SIPRI Yearbook 2011 (Oxford, 2011). 

Monday, June 13, 2011

Global Miltary Spending

Another great daily chart from The Economist on levels of military spending. Note Australia's position and level of spending as a percentage of GDP. Of course the bigger the GDP, the bigger the absolute level of spending.

Note also the fact that the United States spends more than the next 17 countries combined. Indeed, the US accounts for close to half of total world military spending at about $US700 billion.

On a purchasing power parity (PPP) basis (for explanation see here), China's (and much of the rest of the developing world's) level of spending would be more significant. But given that a lot of the spending on military hardware involves international trade, it still must involve the Chinese using yuan to buy foreign components etc, negating at least some of the PPP effect.

China's spending as a percentage of GDP has remained reasonably static, but its GDP has been growing at about 10 per cent a year, so its military spending has also been growing rapidly as well. SIPRI estimates that its military spending has increased by almost 200 per cent since 2001 (via The Economist).