Those wanting a good summary of India's development, especially in comparison to China and its impact on Australia should read
Some of the graphs provide are excellent.
Chart 1: Working age population as a proportion of population
This means that India is better set up demographically than China for the future. In countries like Australia there will be more old people to support and the retirement age will no doubt push out to 70 as people generally live longer. (My heart bleeds for those Greeks who believe that shifting the retirement age beyond 55 for "arduous" jobs represents severe sacrifice)
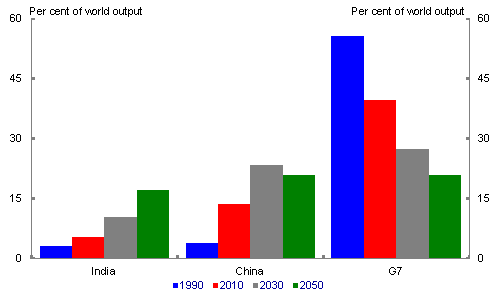
Chart 2: Long term projections — India, China and G7
Of course much could go wrong!!
Chart 3: GDP per capita as a proportion of the US
The interesting thing about this projection is that in the 1980s it was assumed that Japan would soon match US GDP per capita, which is an important indicator of real progress.
Chart 4: Population of India and China
Both countries it seems will need more girls if there are not to be a lot of young men without girlfriends and wives!
Chart 5: Participation rates for India and China
India still has a long way to go to encourage more workers to participate in the formal work sector. Changes in regulations will probably increase the participation rate in India in the future, providing further advantages for the Indian economy.
Chart 6: Australia’s exports of education services to India
The authors report that:
While the opportunities that India's growth represents to Australia are huge, the education sector shows that things can go wrong. The breakneck expansion of the sector led to many shonky operators, especially in the VET sector. The high Australian dollar has probably also had a negative effect on Australia. Why study in Australia when you can study in the US more cheaply.
"India's long-term growth potential and the implications for Australia"
by Ben Ralston, Wilson Au-Yeung and Bill BrummittSome of the graphs provide are excellent.
Chart 1: Working age population as a proportion of population
This means that India is better set up demographically than China for the future. In countries like Australia there will be more old people to support and the retirement age will no doubt push out to 70 as people generally live longer. (My heart bleeds for those Greeks who believe that shifting the retirement age beyond 55 for "arduous" jobs represents severe sacrifice)
Chart 2: Long term projections — India, China and G7
Of course much could go wrong!!
Chart 3: GDP per capita as a proportion of the US
The interesting thing about this projection is that in the 1980s it was assumed that Japan would soon match US GDP per capita, which is an important indicator of real progress.
Chart 4: Population of India and China
Both countries it seems will need more girls if there are not to be a lot of young men without girlfriends and wives!
Chart 5: Participation rates for India and China
India still has a long way to go to encourage more workers to participate in the formal work sector. Changes in regulations will probably increase the participation rate in India in the future, providing further advantages for the Indian economy.
Chart 6: Australia’s exports of education services to India
The authors report that:
Currently around 11 million Indian students are pursuing higher education — but this
represents just 11 per cent of the nation’s 17-23 year olds. The level of unmet demand
for university places runs at around 4.7 million places each year.
Government policy is directed towards increasing the Gross Enrolment Ratio — the
ratio of actual students to potential students — to 25 per cent by 2022.
To supply the necessary places, India intends to set up around 1,500 new higher
education institutions, at least one central university in each state, and 14 new
innovation universities.
The opportunities for Australian universities, whether in terms of partnering with
Indian institutions during this growth phase or attracting more Indian international
students to Australia are clear.
In terms of vocational education and training, the scope of opportunity is also
impressive. The Australian Government has identified opportunities to increase the
delivery of Australian vocational education and training (VET) qualifications in India.
At present only 2-2.5 per cent of India’s population undertakes formal VET training.
However, it is estimated that some 500 million people will require training by 2022 —
over 21 times Australia’s population. The current capacity of the Indian VET system is
around 4.3 million training places.
The challenge for India is enormous and India recognises that it cannot achieve these
goals alone.
The scale of needs in India has seen our exports of education services to IndiaIt seems that there will be more Australian academics in India in coming years!
experience roughly a 28 fold increase in dollars spent over the 15 years to 2010.32 These
exports remain at very high levels and the whole trade is now on a much more
sustainable path after the Government’s series of visa reforms.
While the opportunities that India's growth represents to Australia are huge, the education sector shows that things can go wrong. The breakneck expansion of the sector led to many shonky operators, especially in the VET sector. The high Australian dollar has probably also had a negative effect on Australia. Why study in Australia when you can study in the US more cheaply.


